AYLIEN leverages Artificial Intelligence to empower thousands of forward-thinking enterprises and developers to collect, analyze, and understand vast amounts of human-generated content.
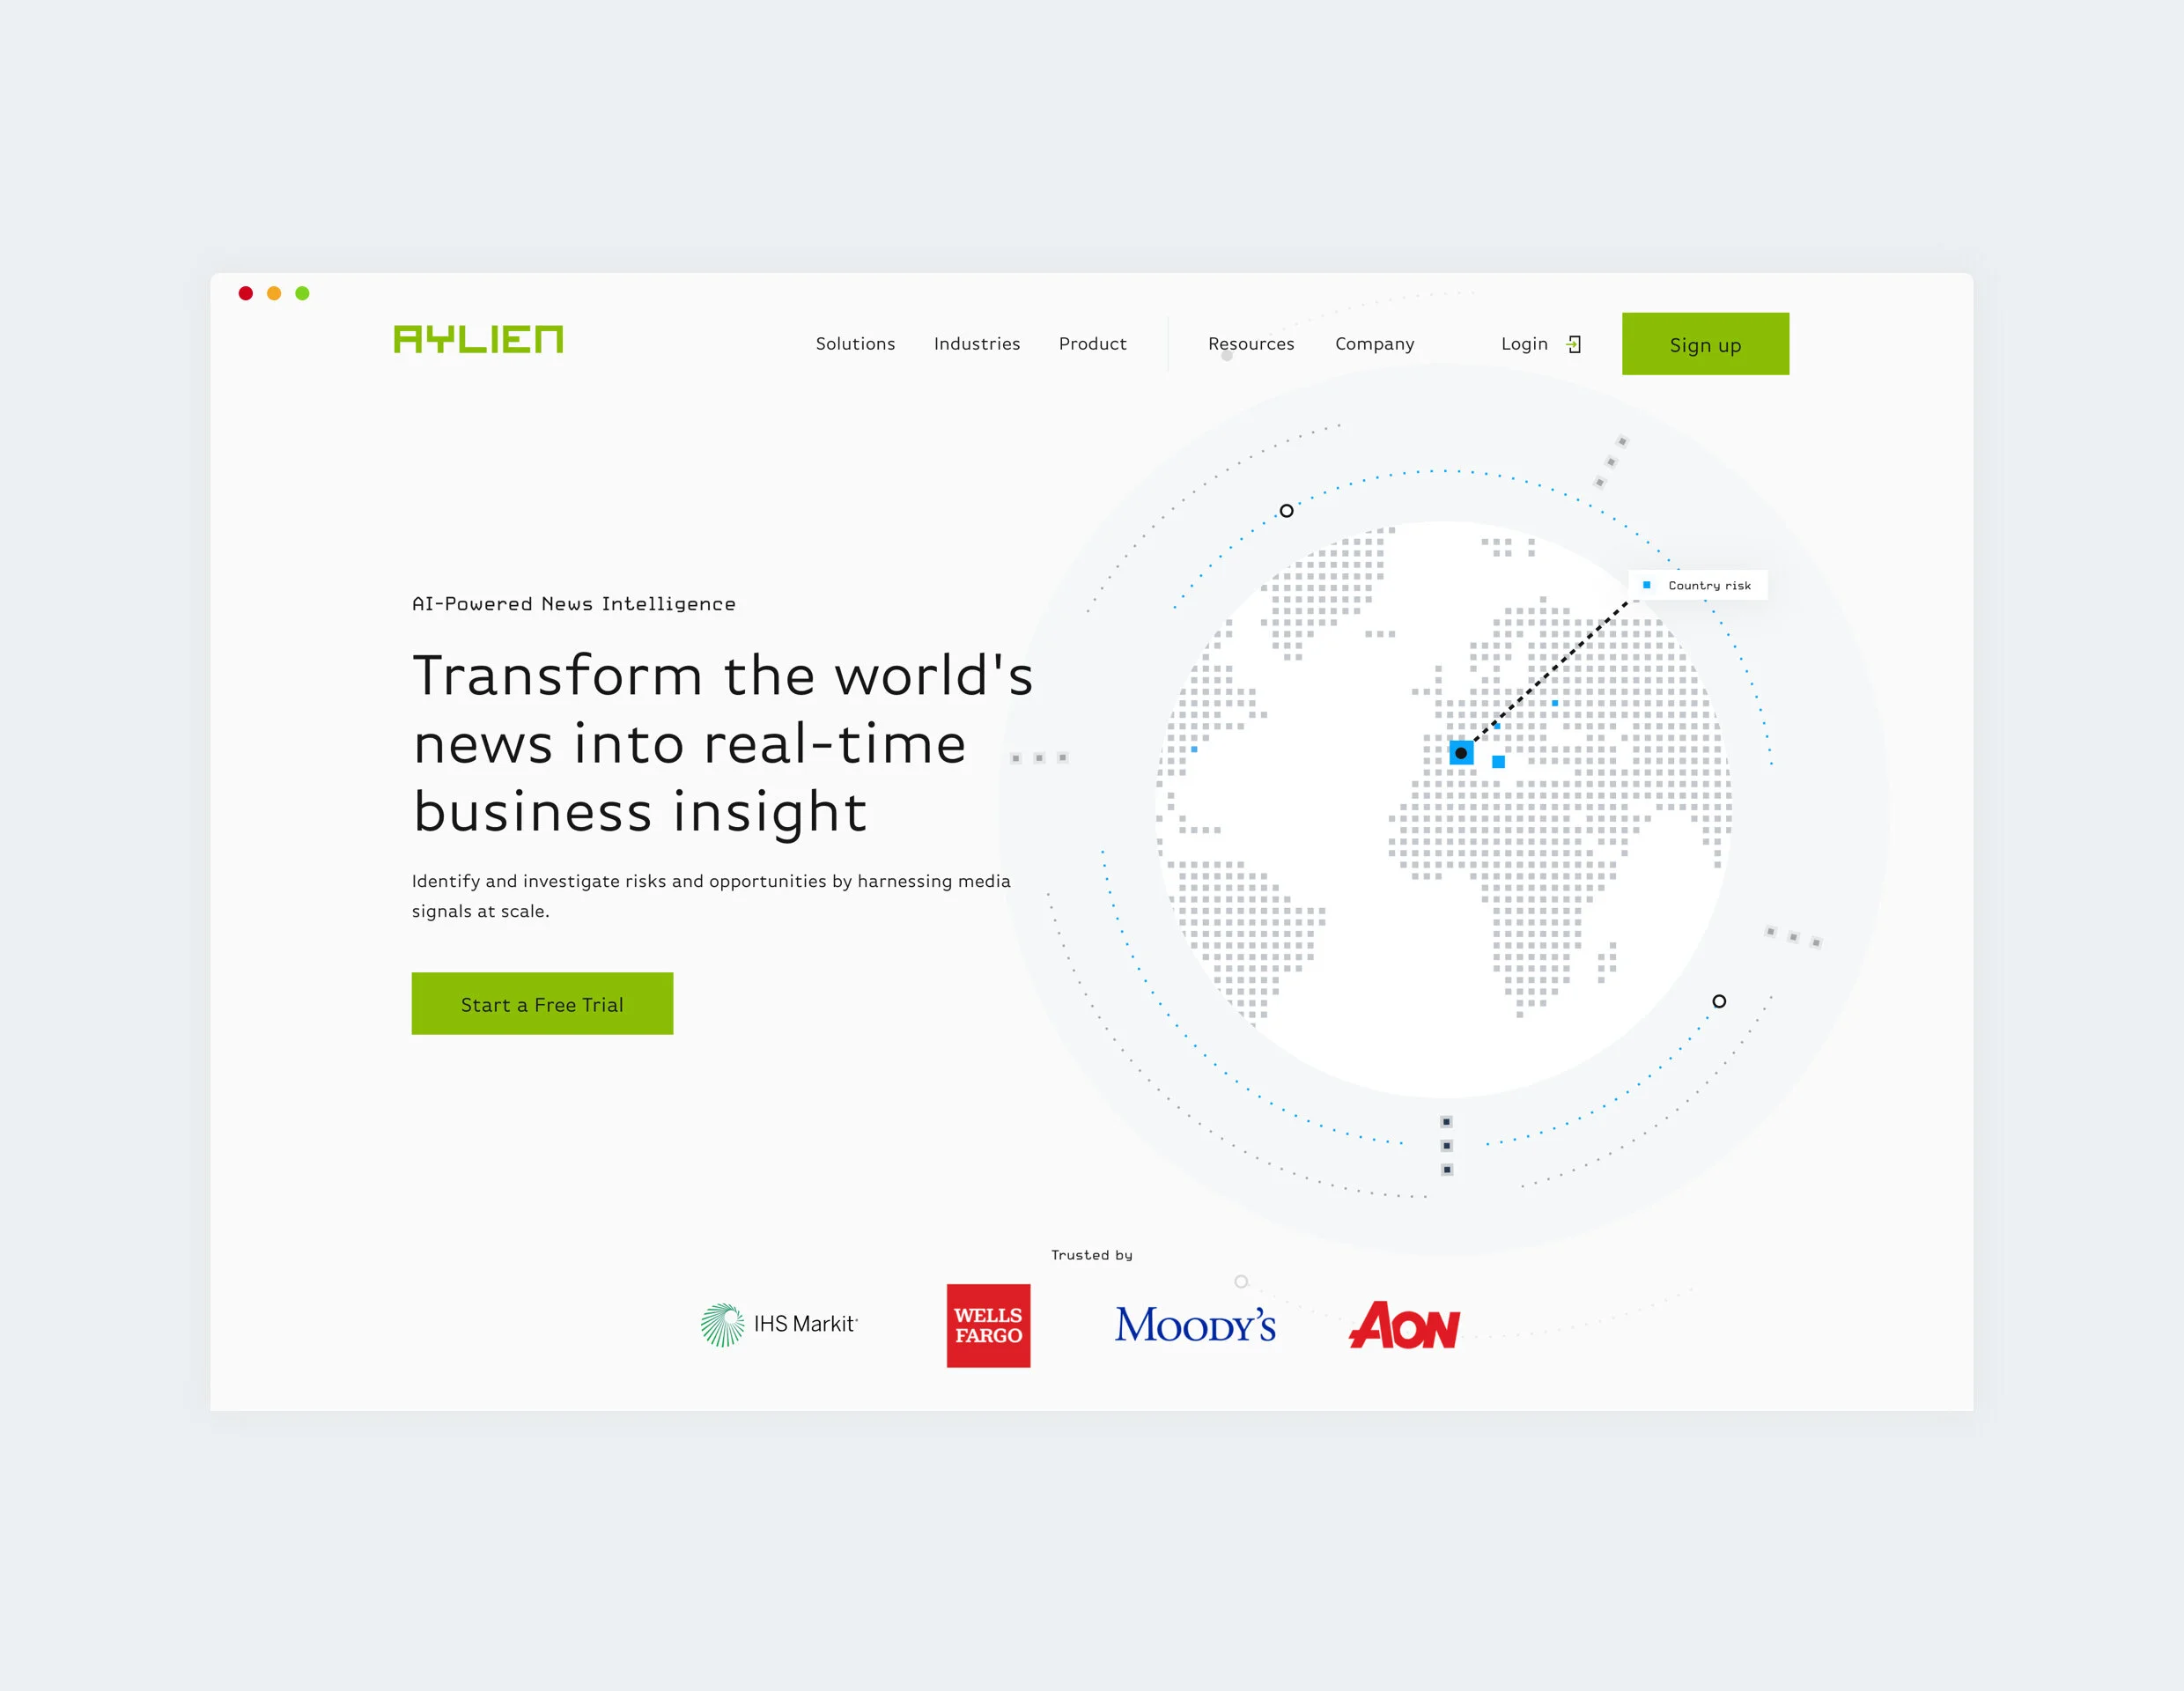
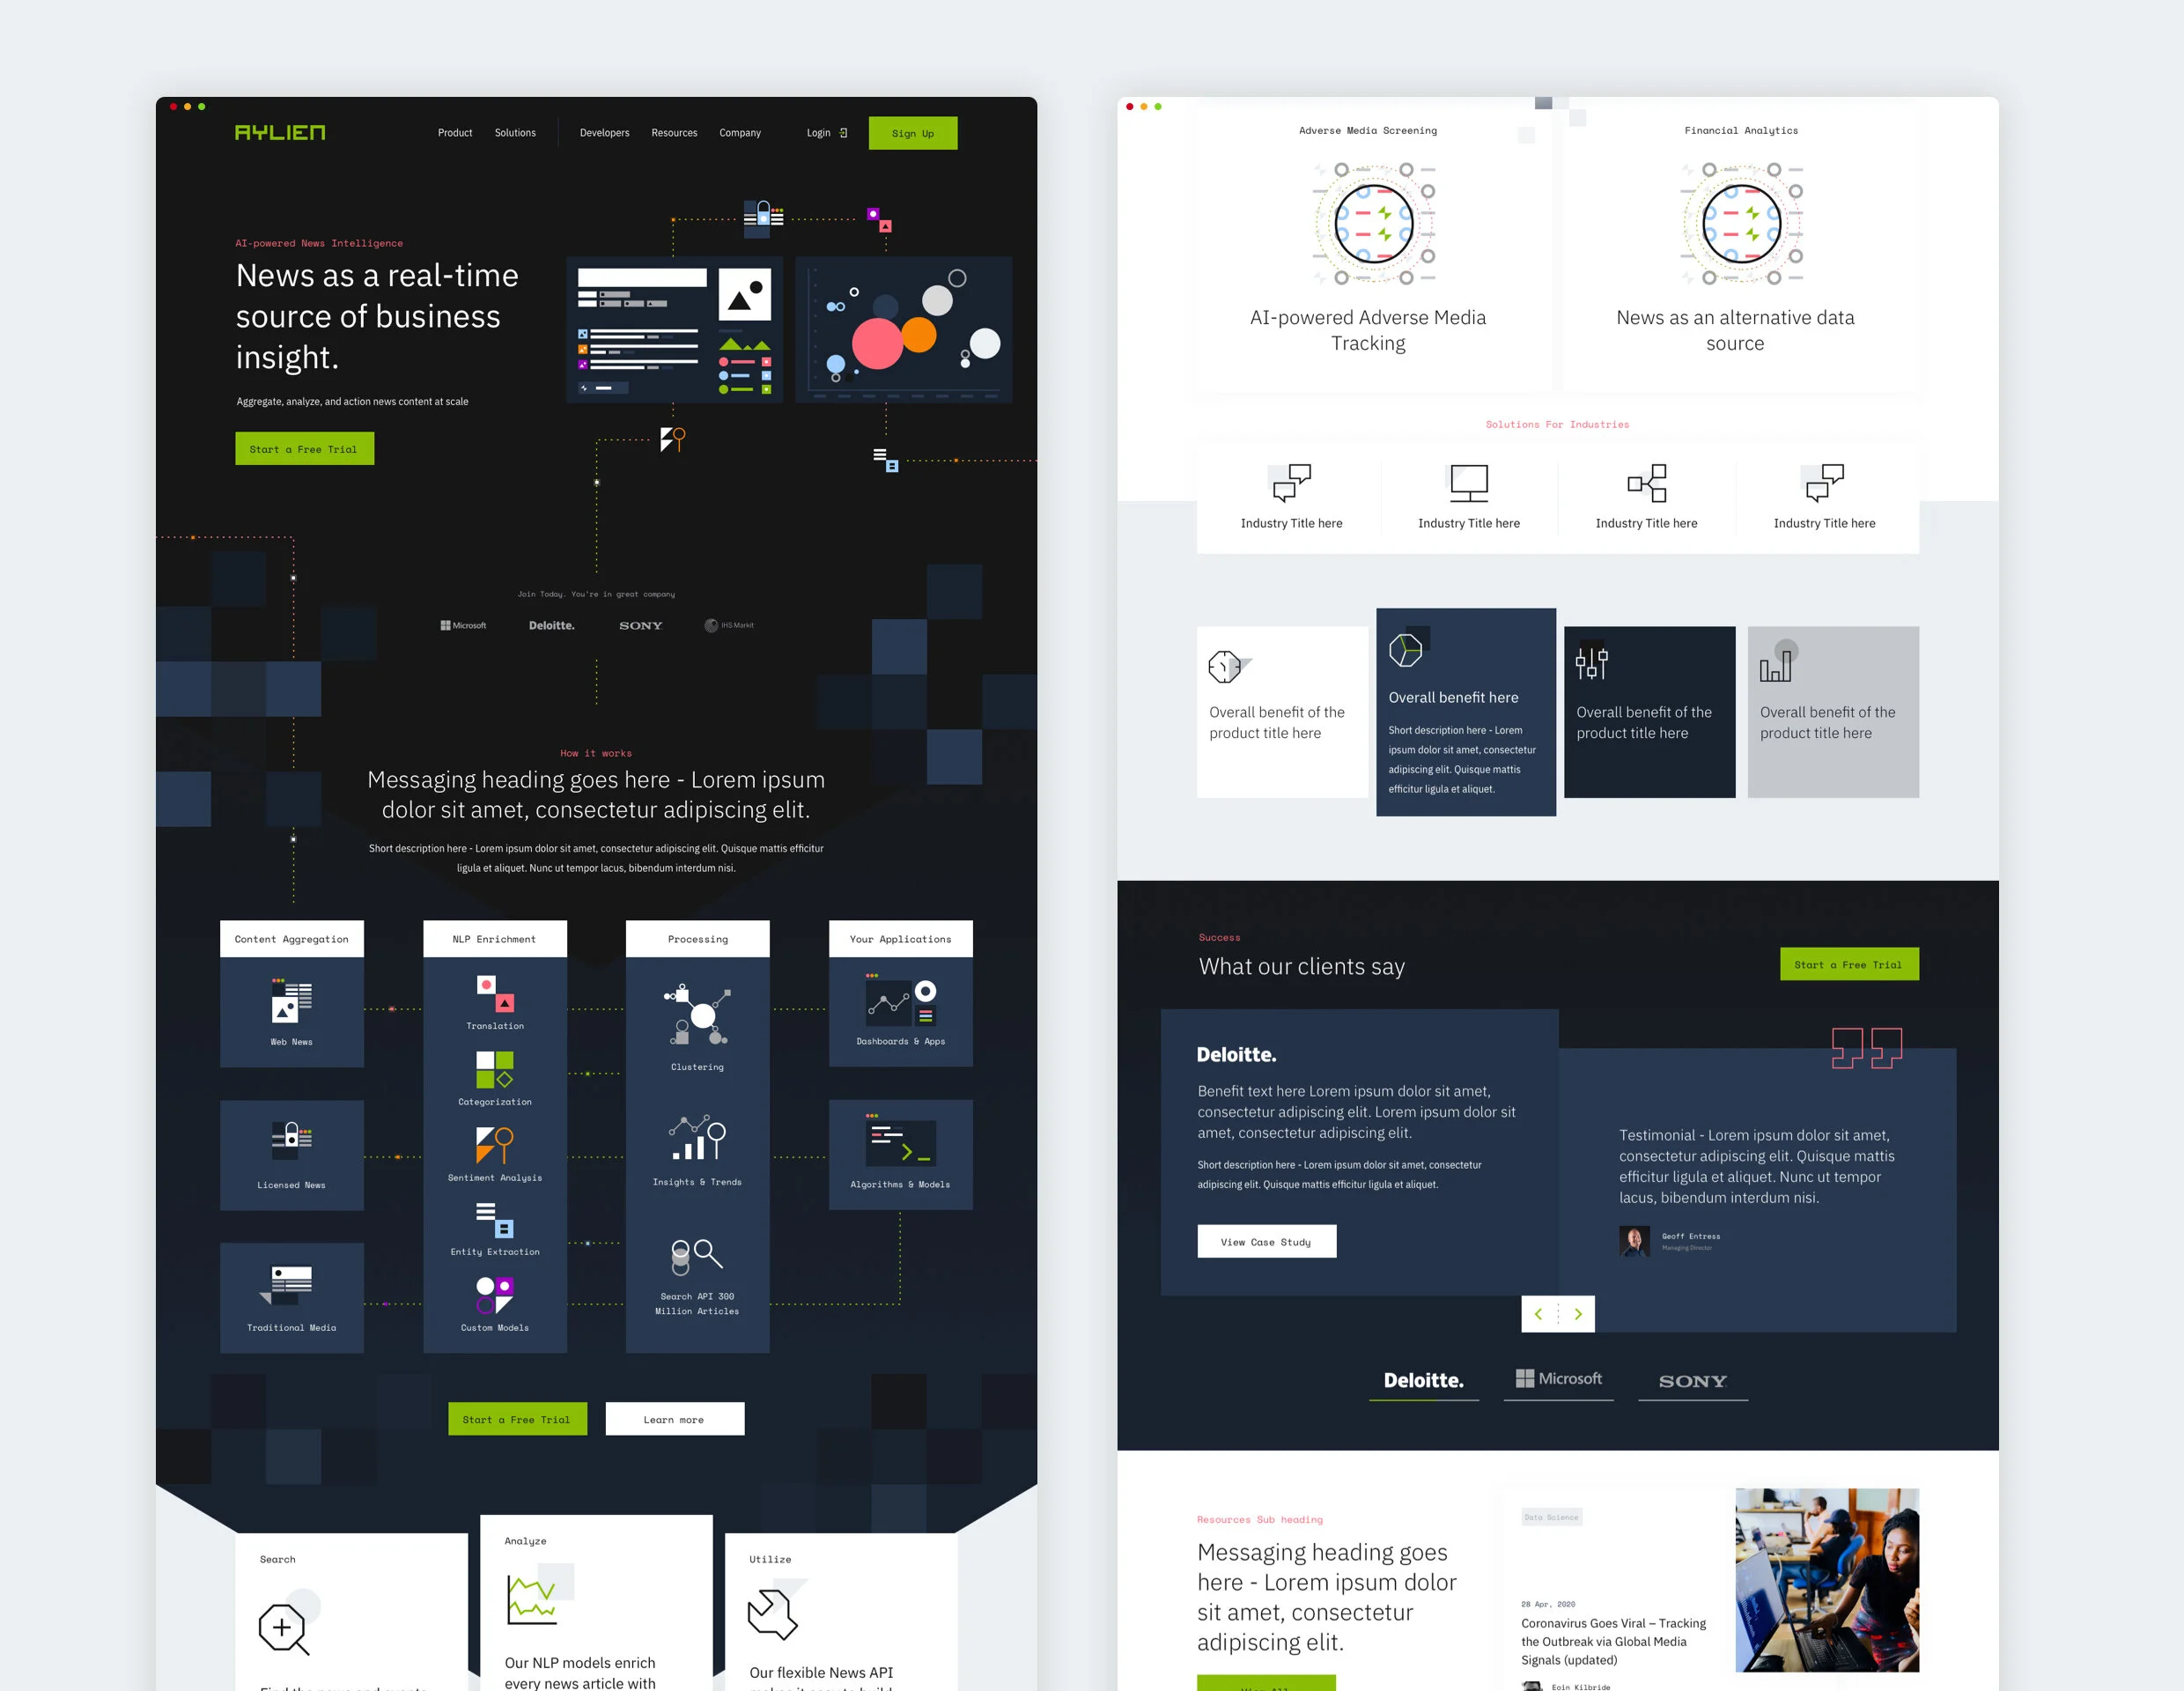
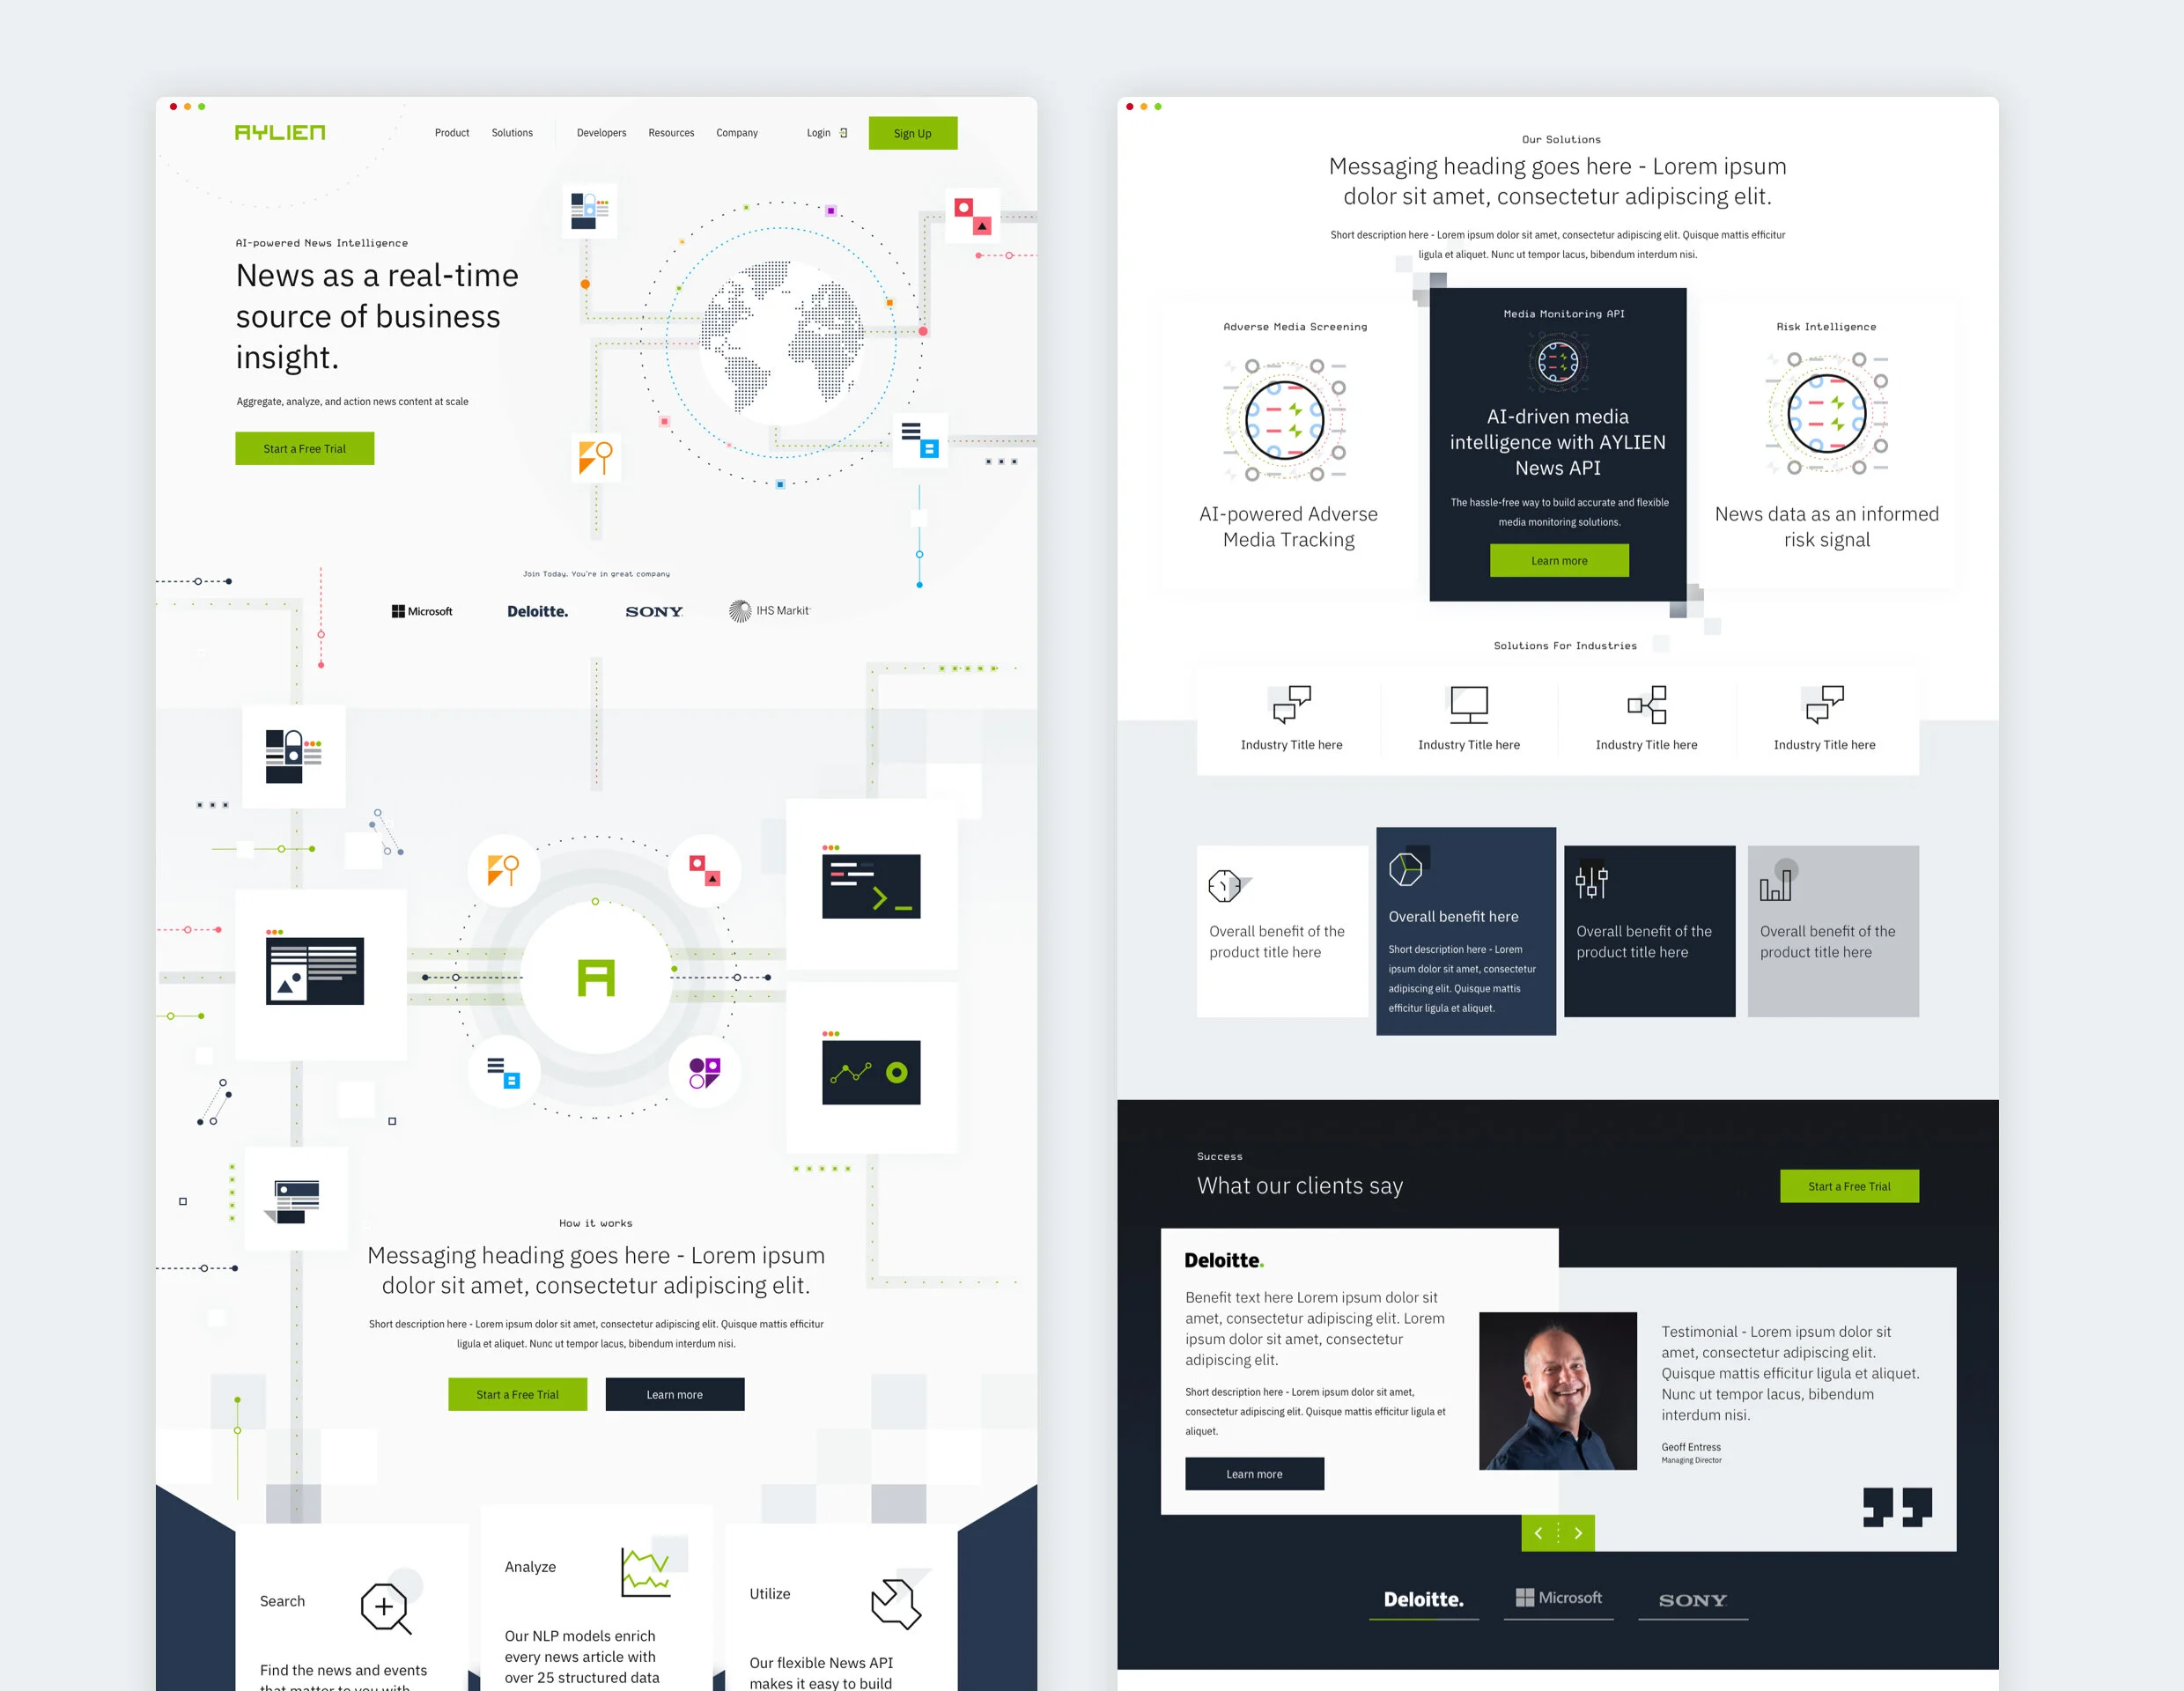
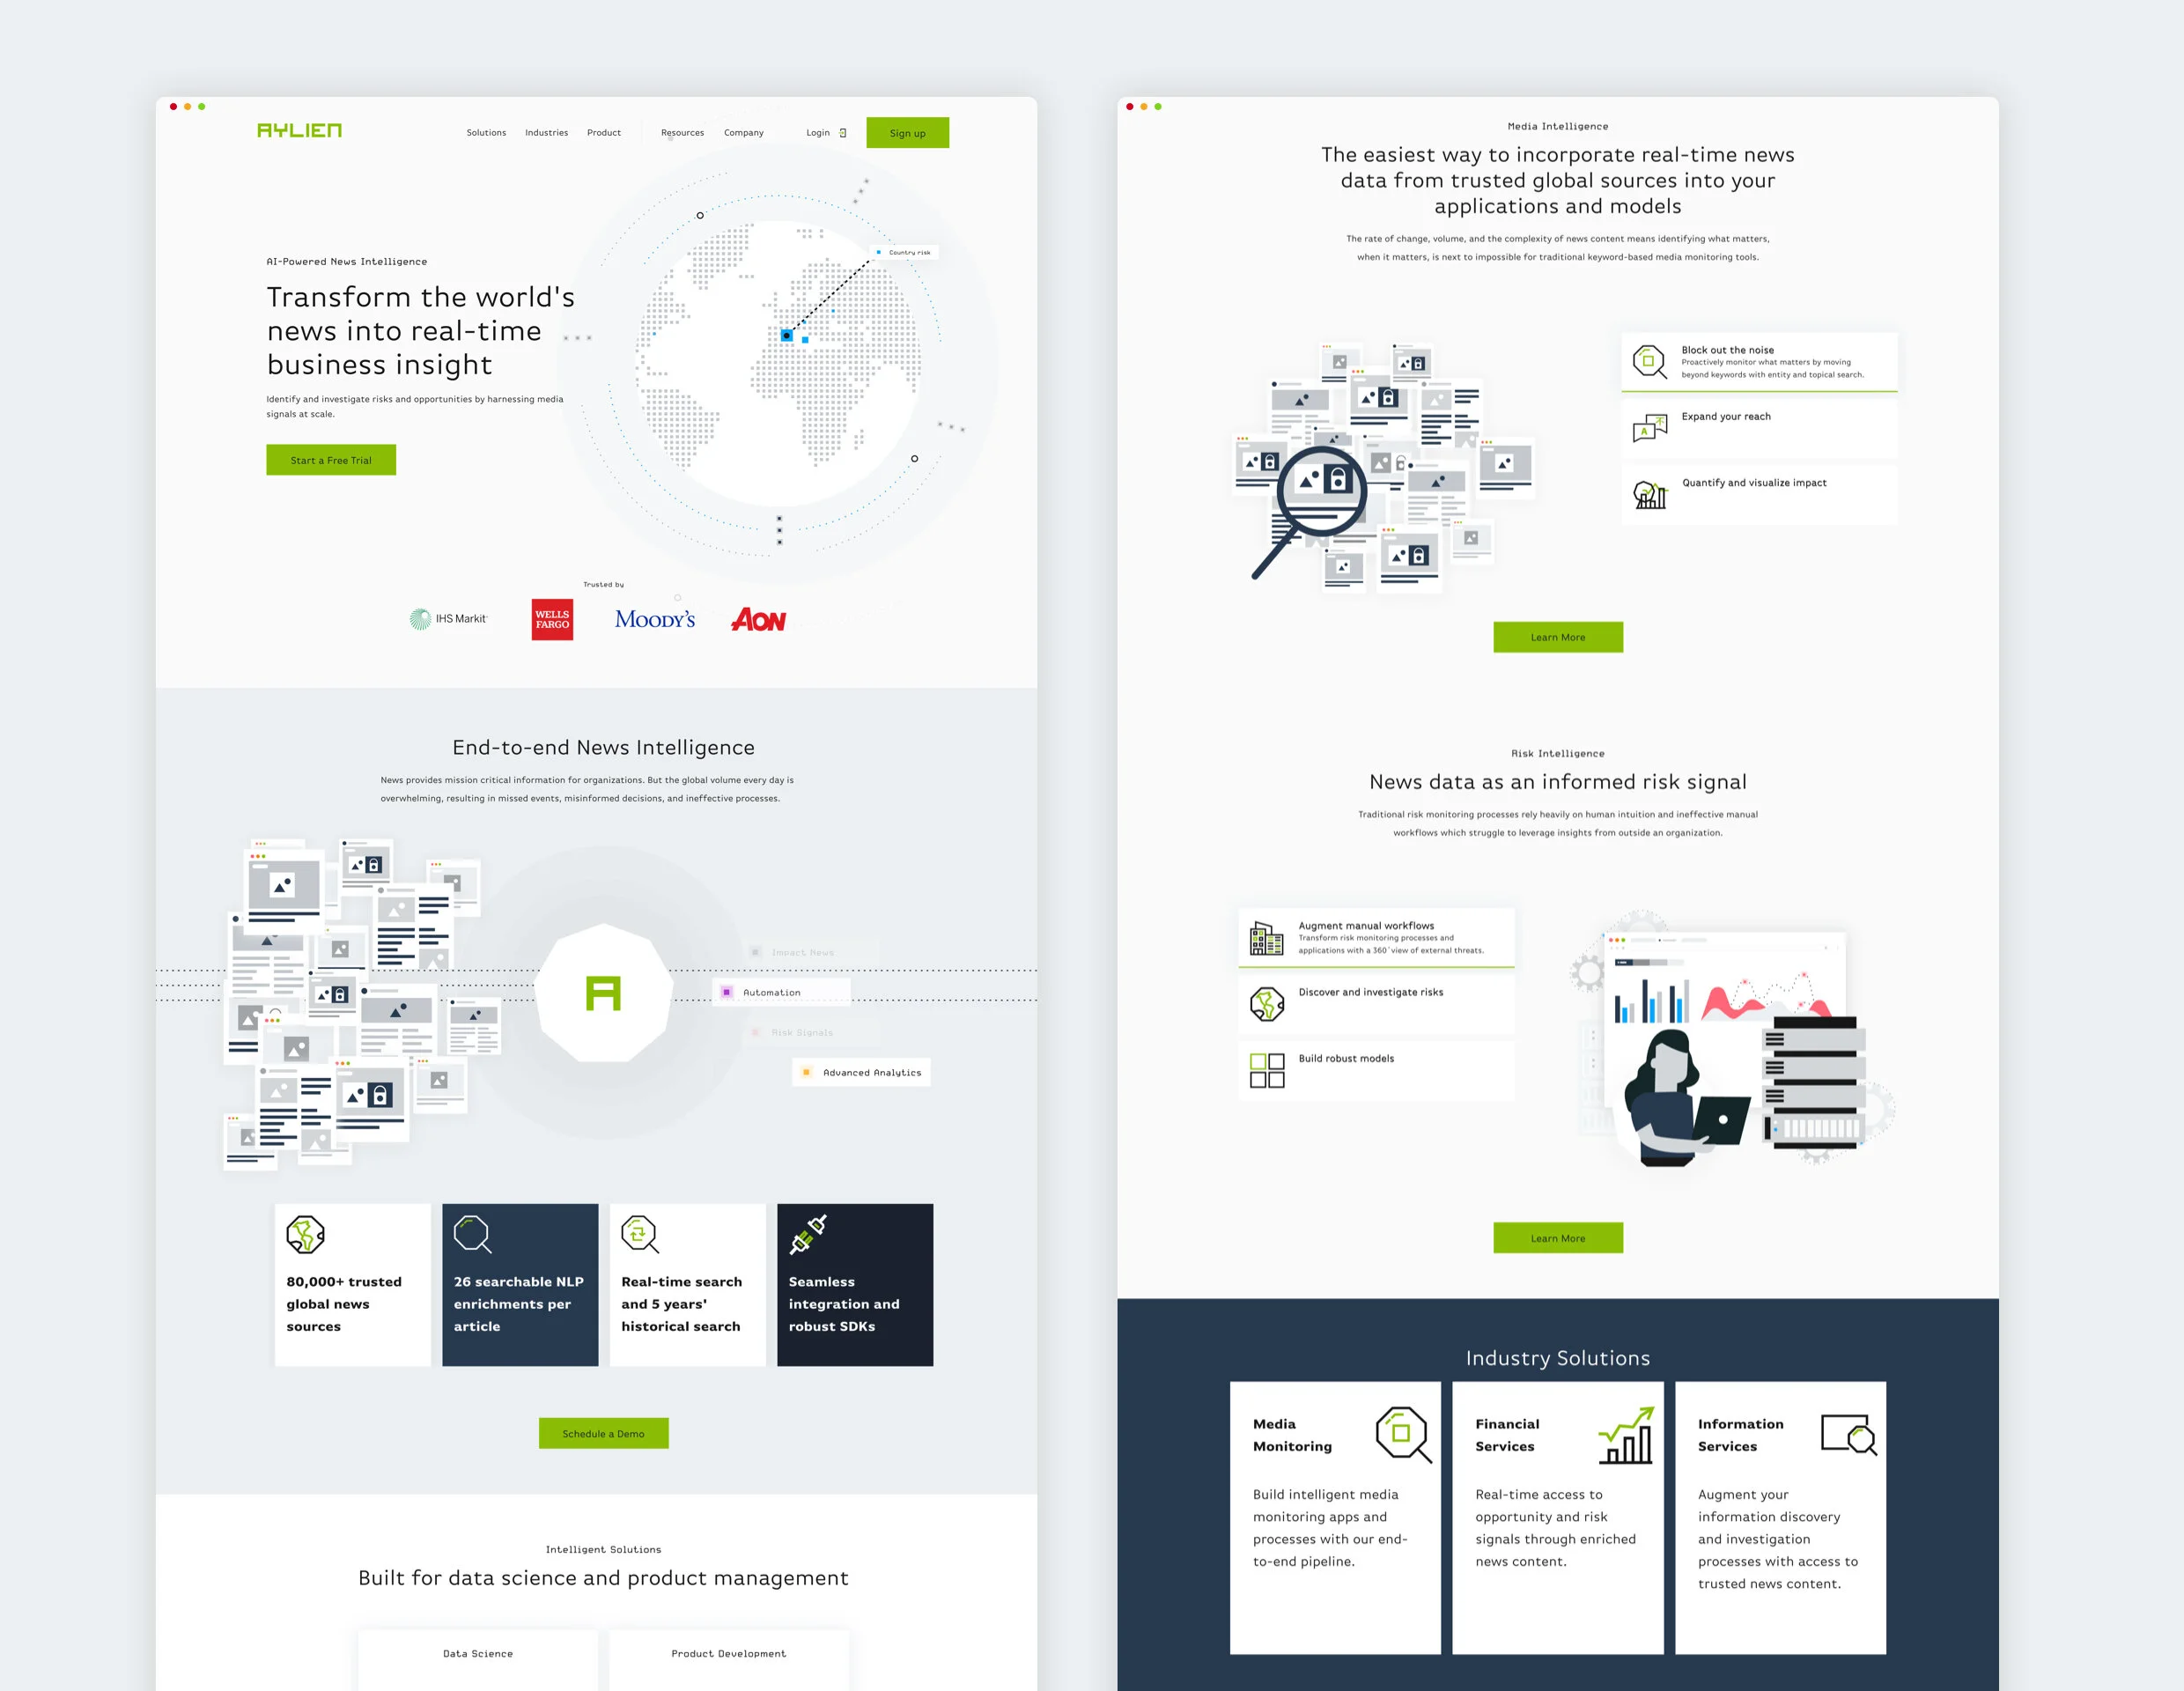
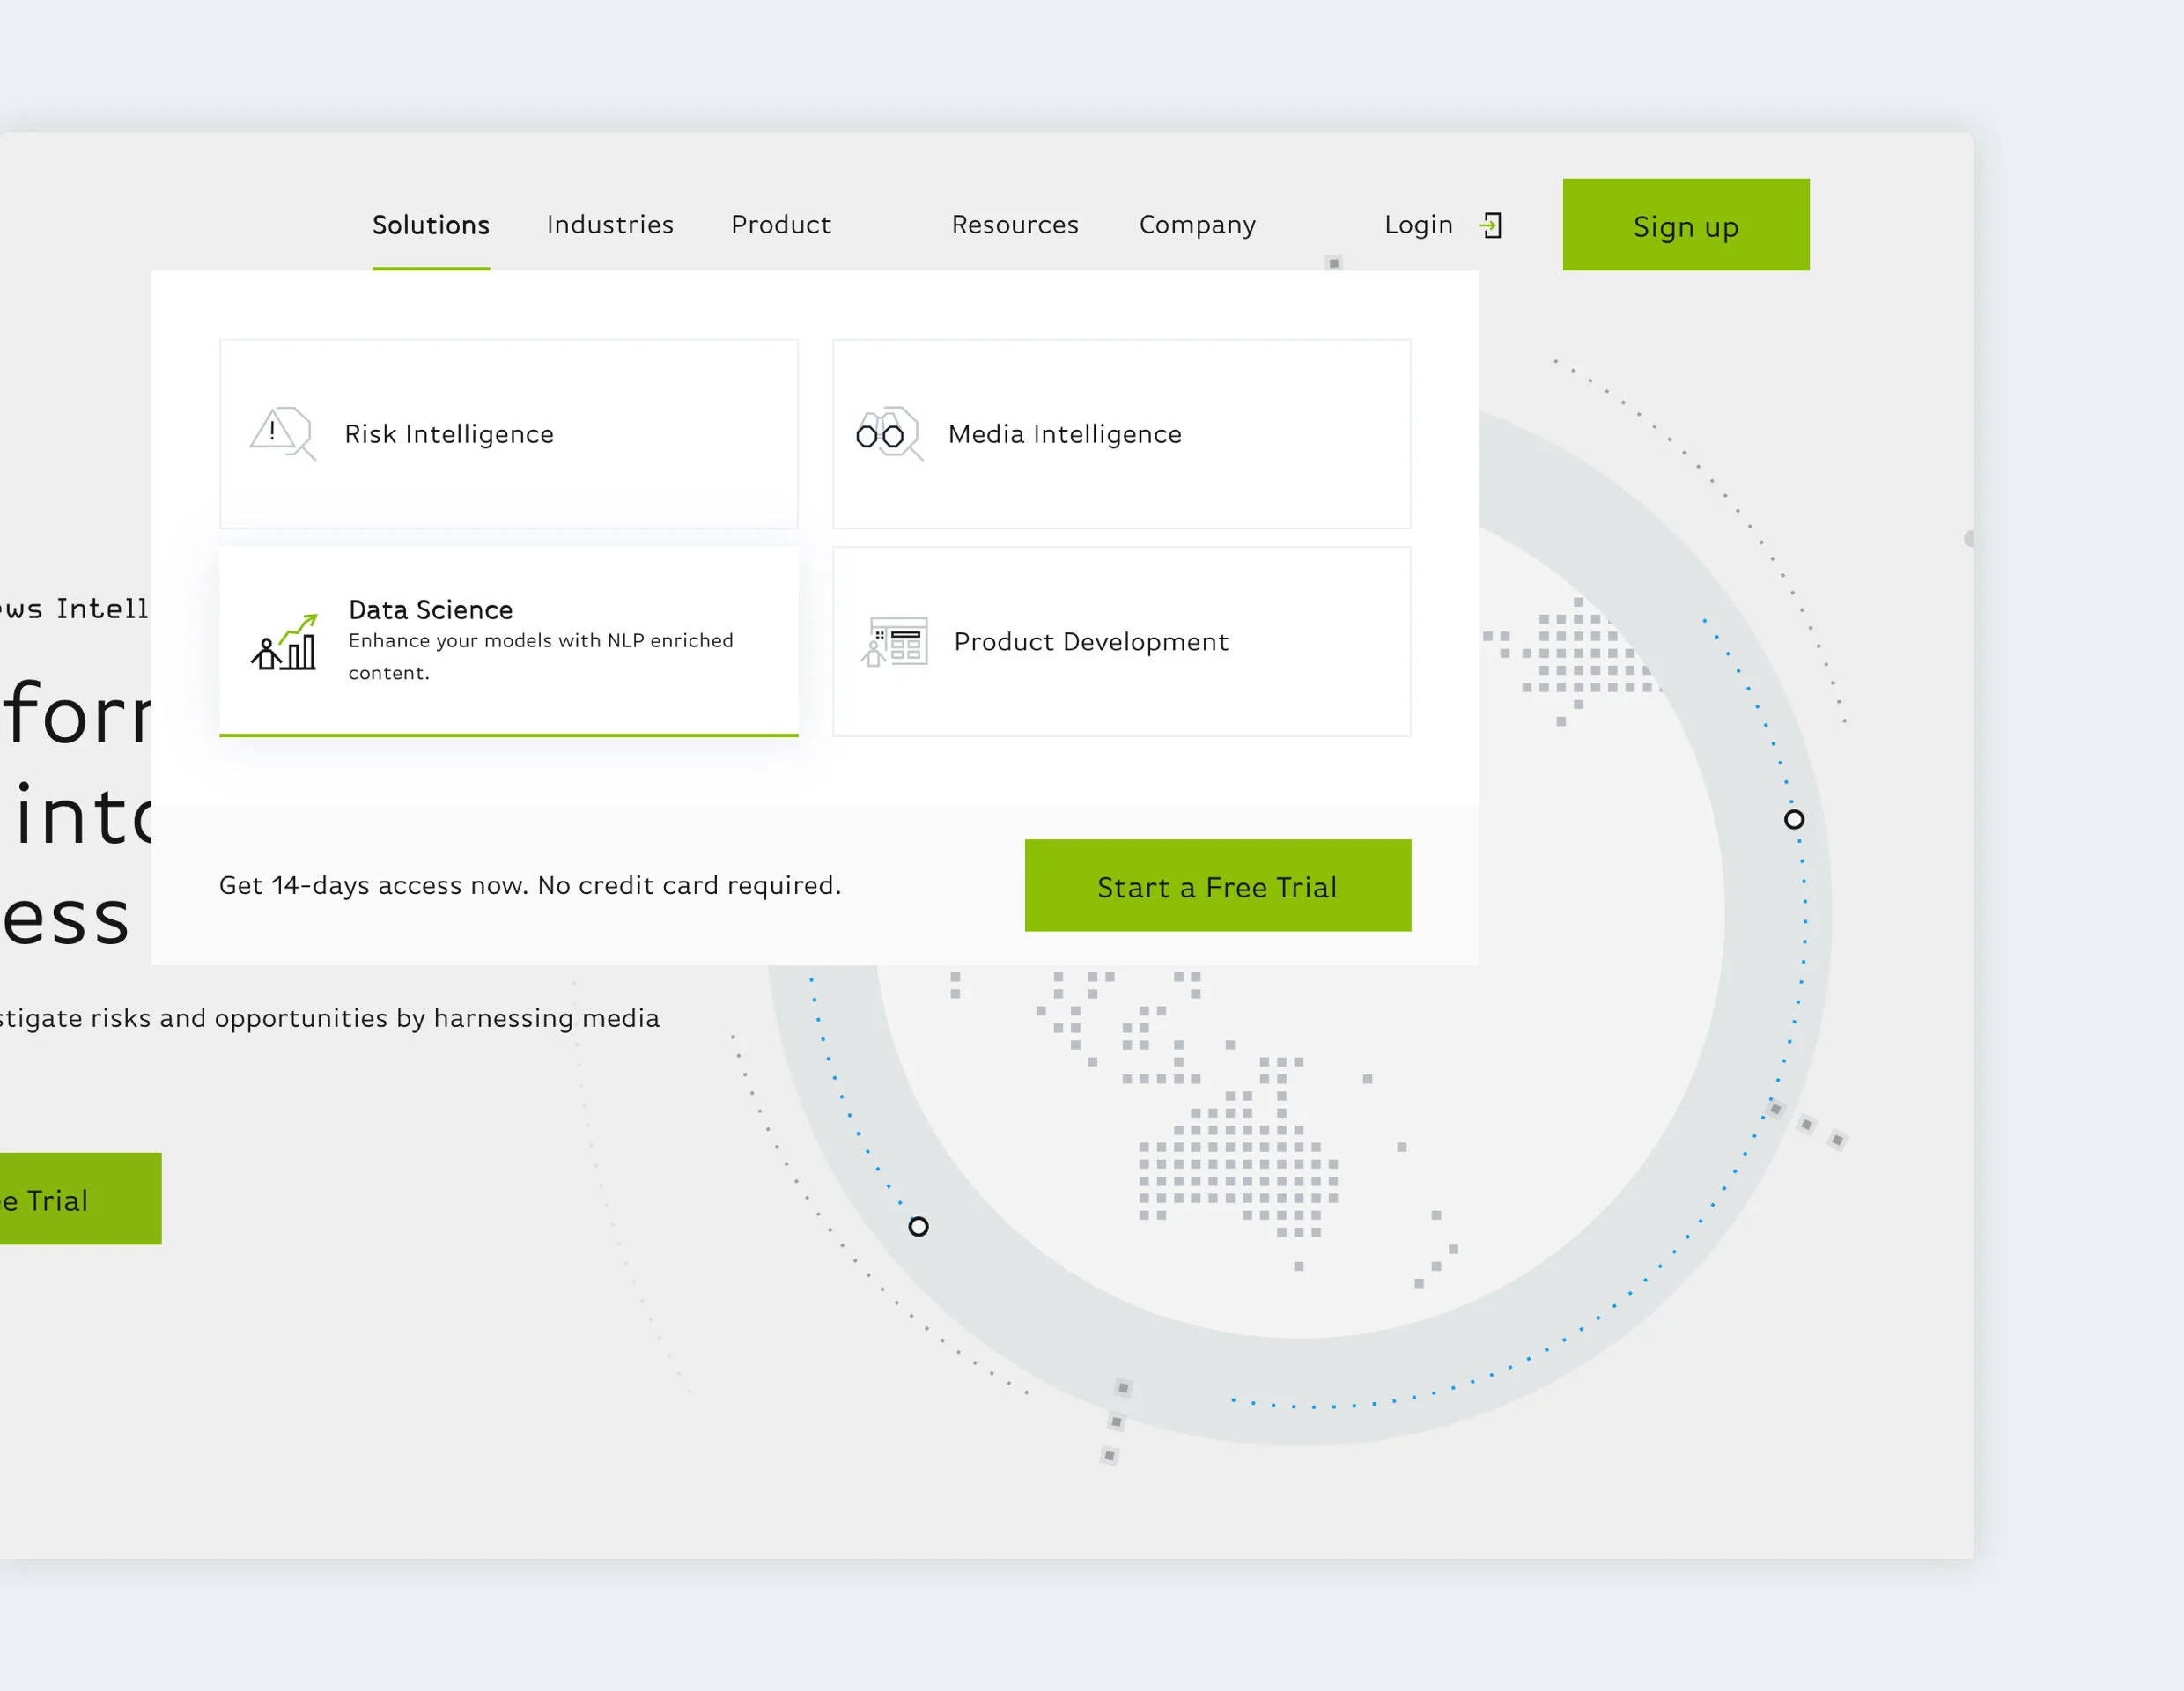
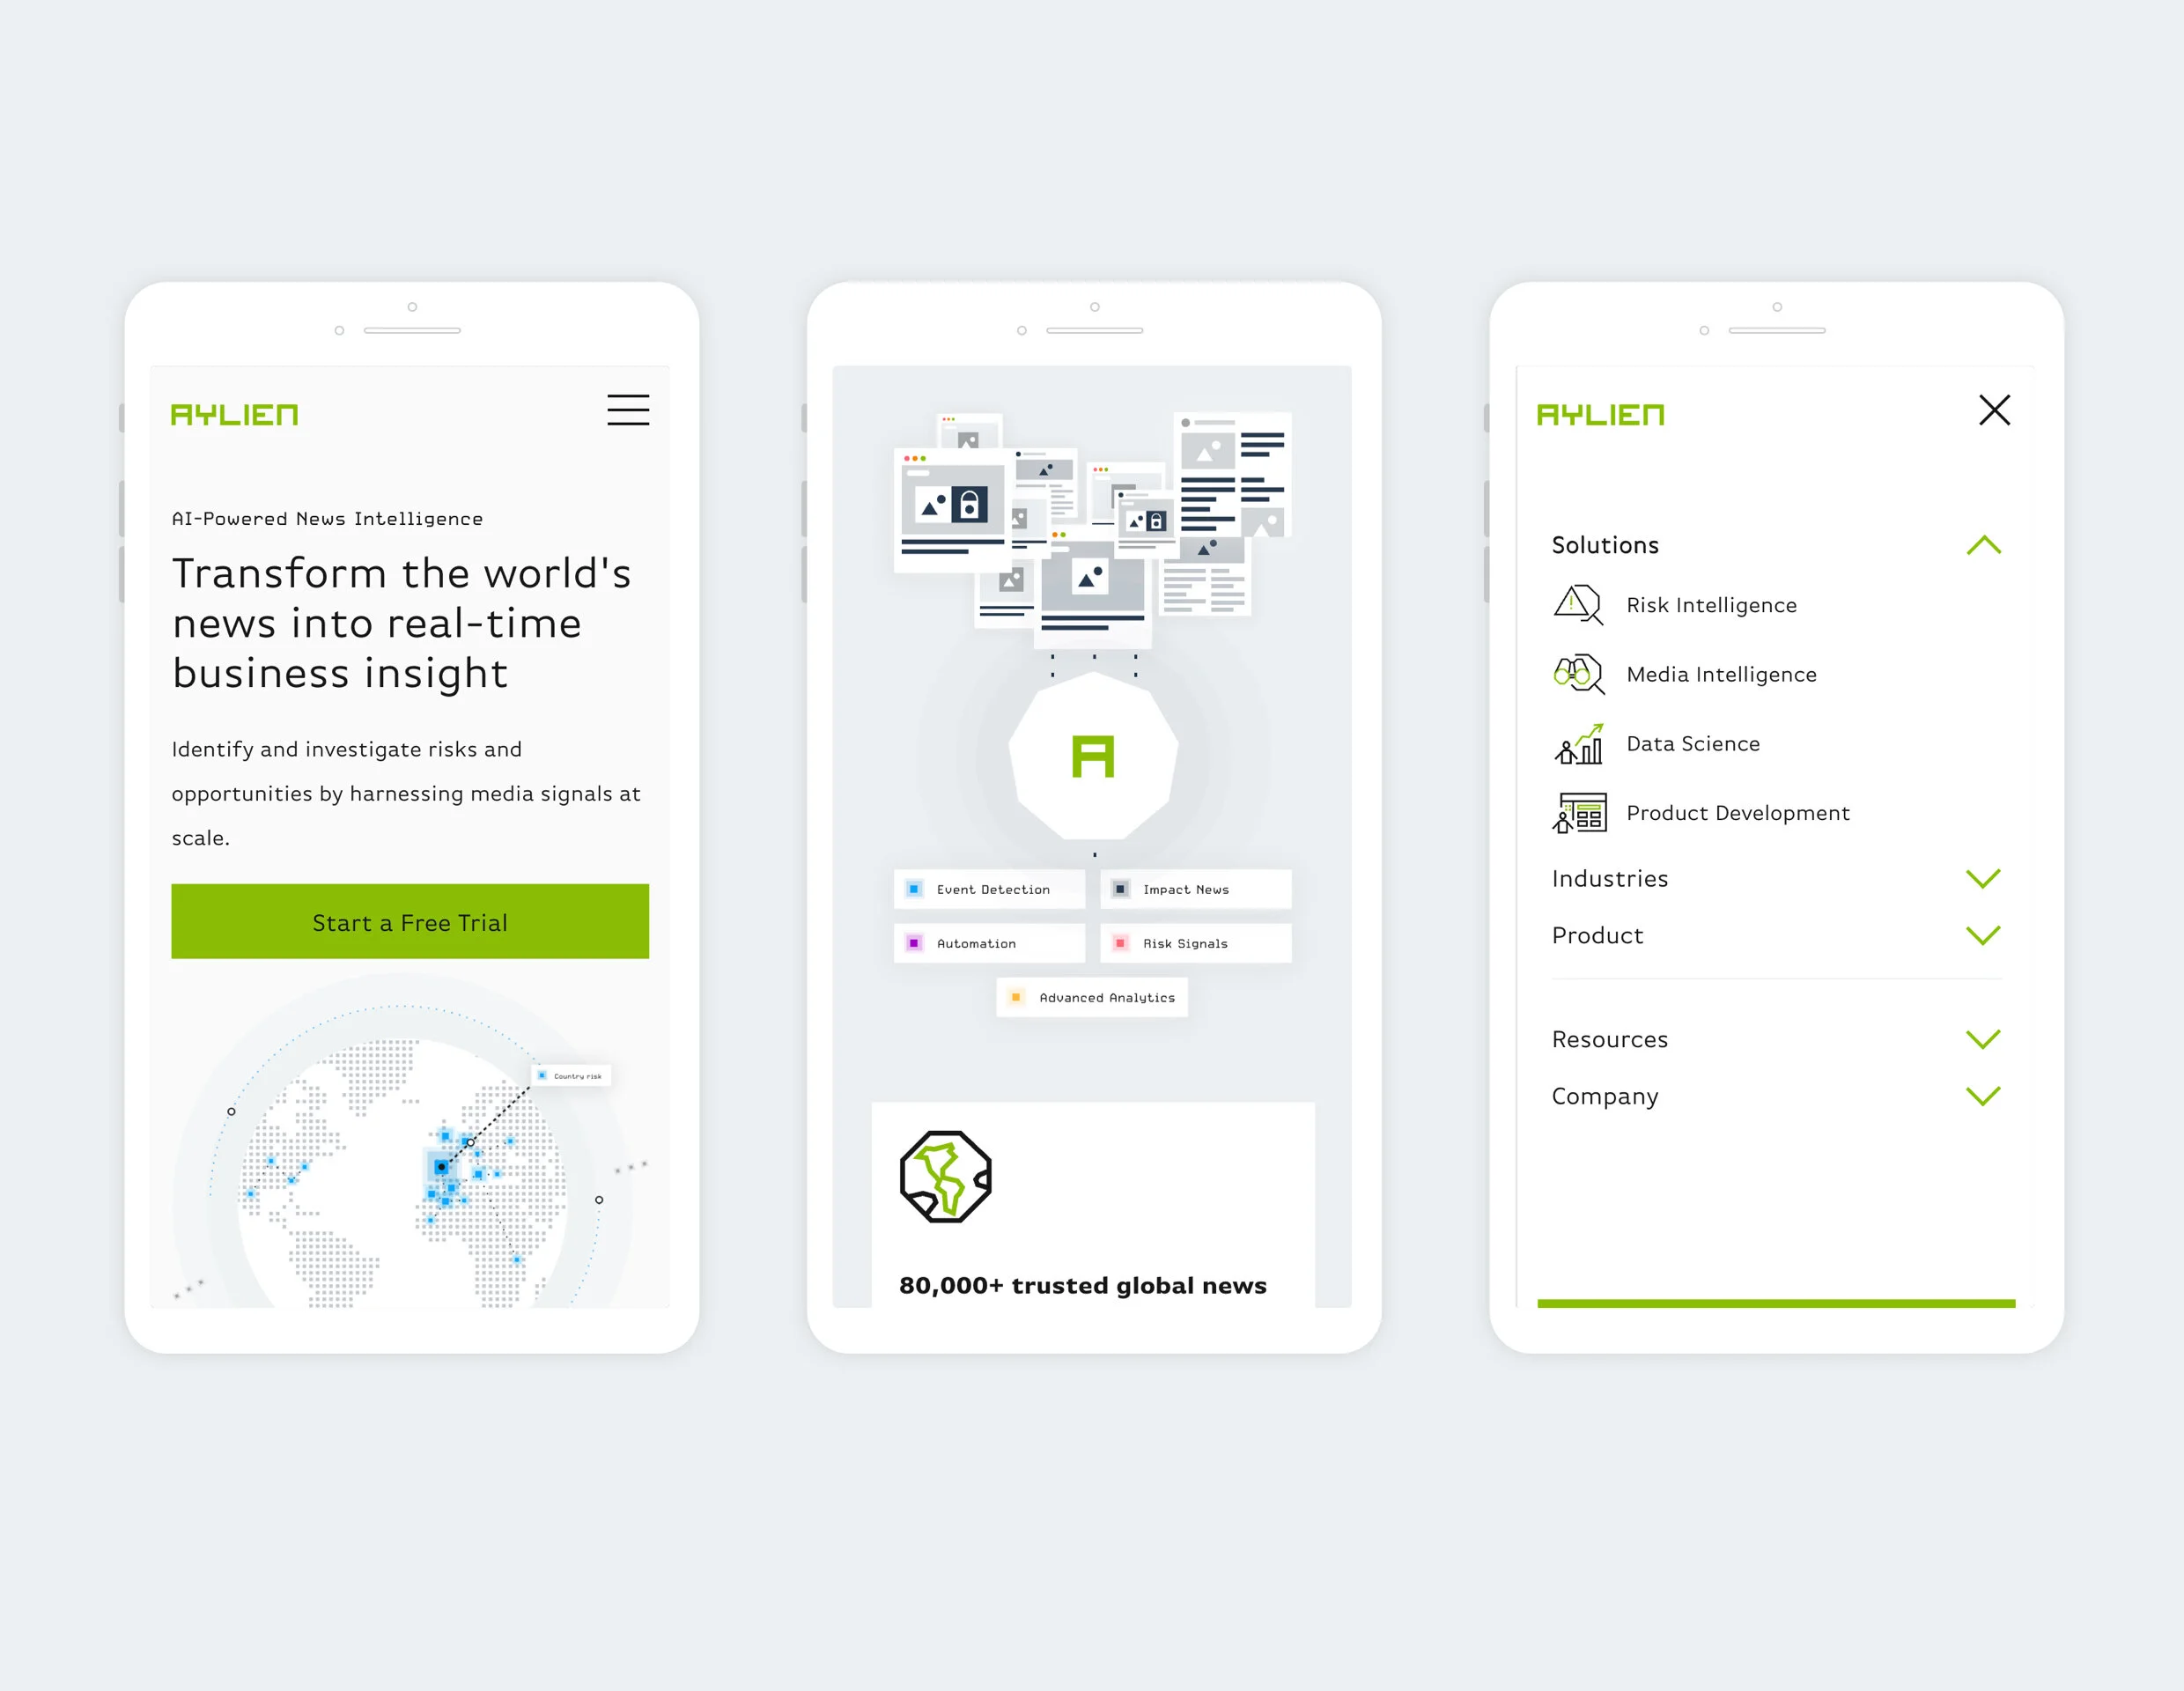
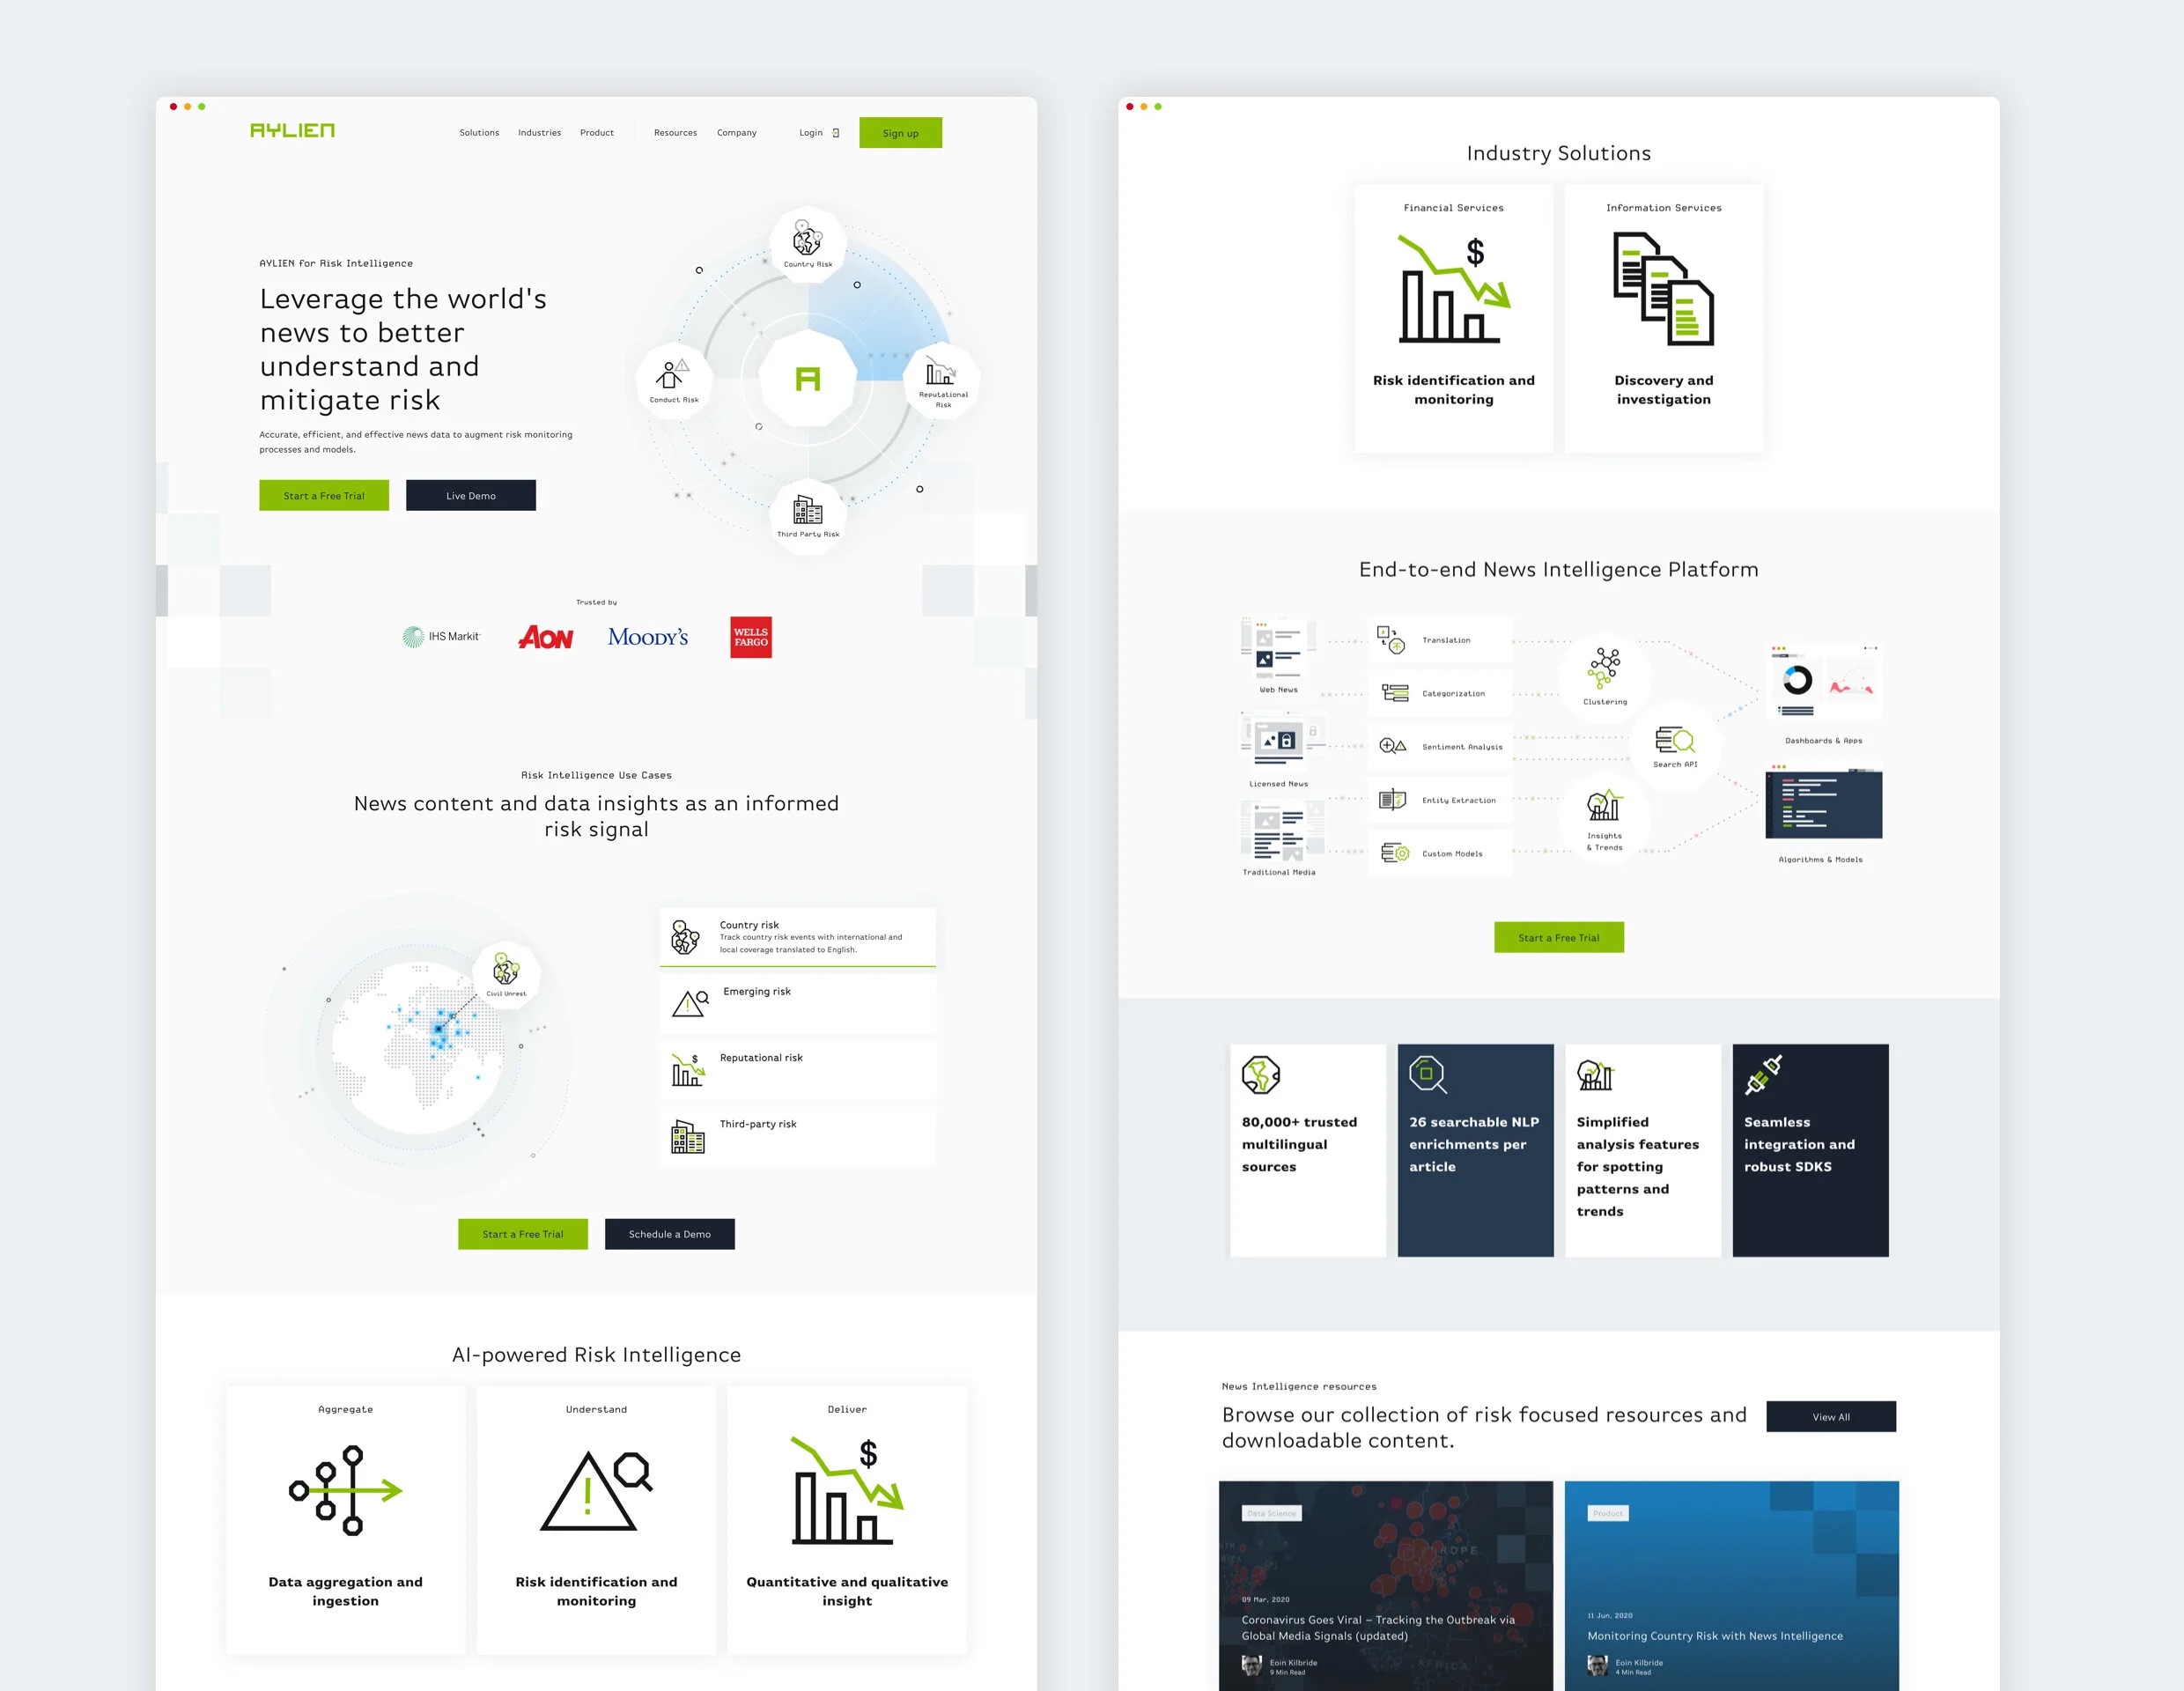
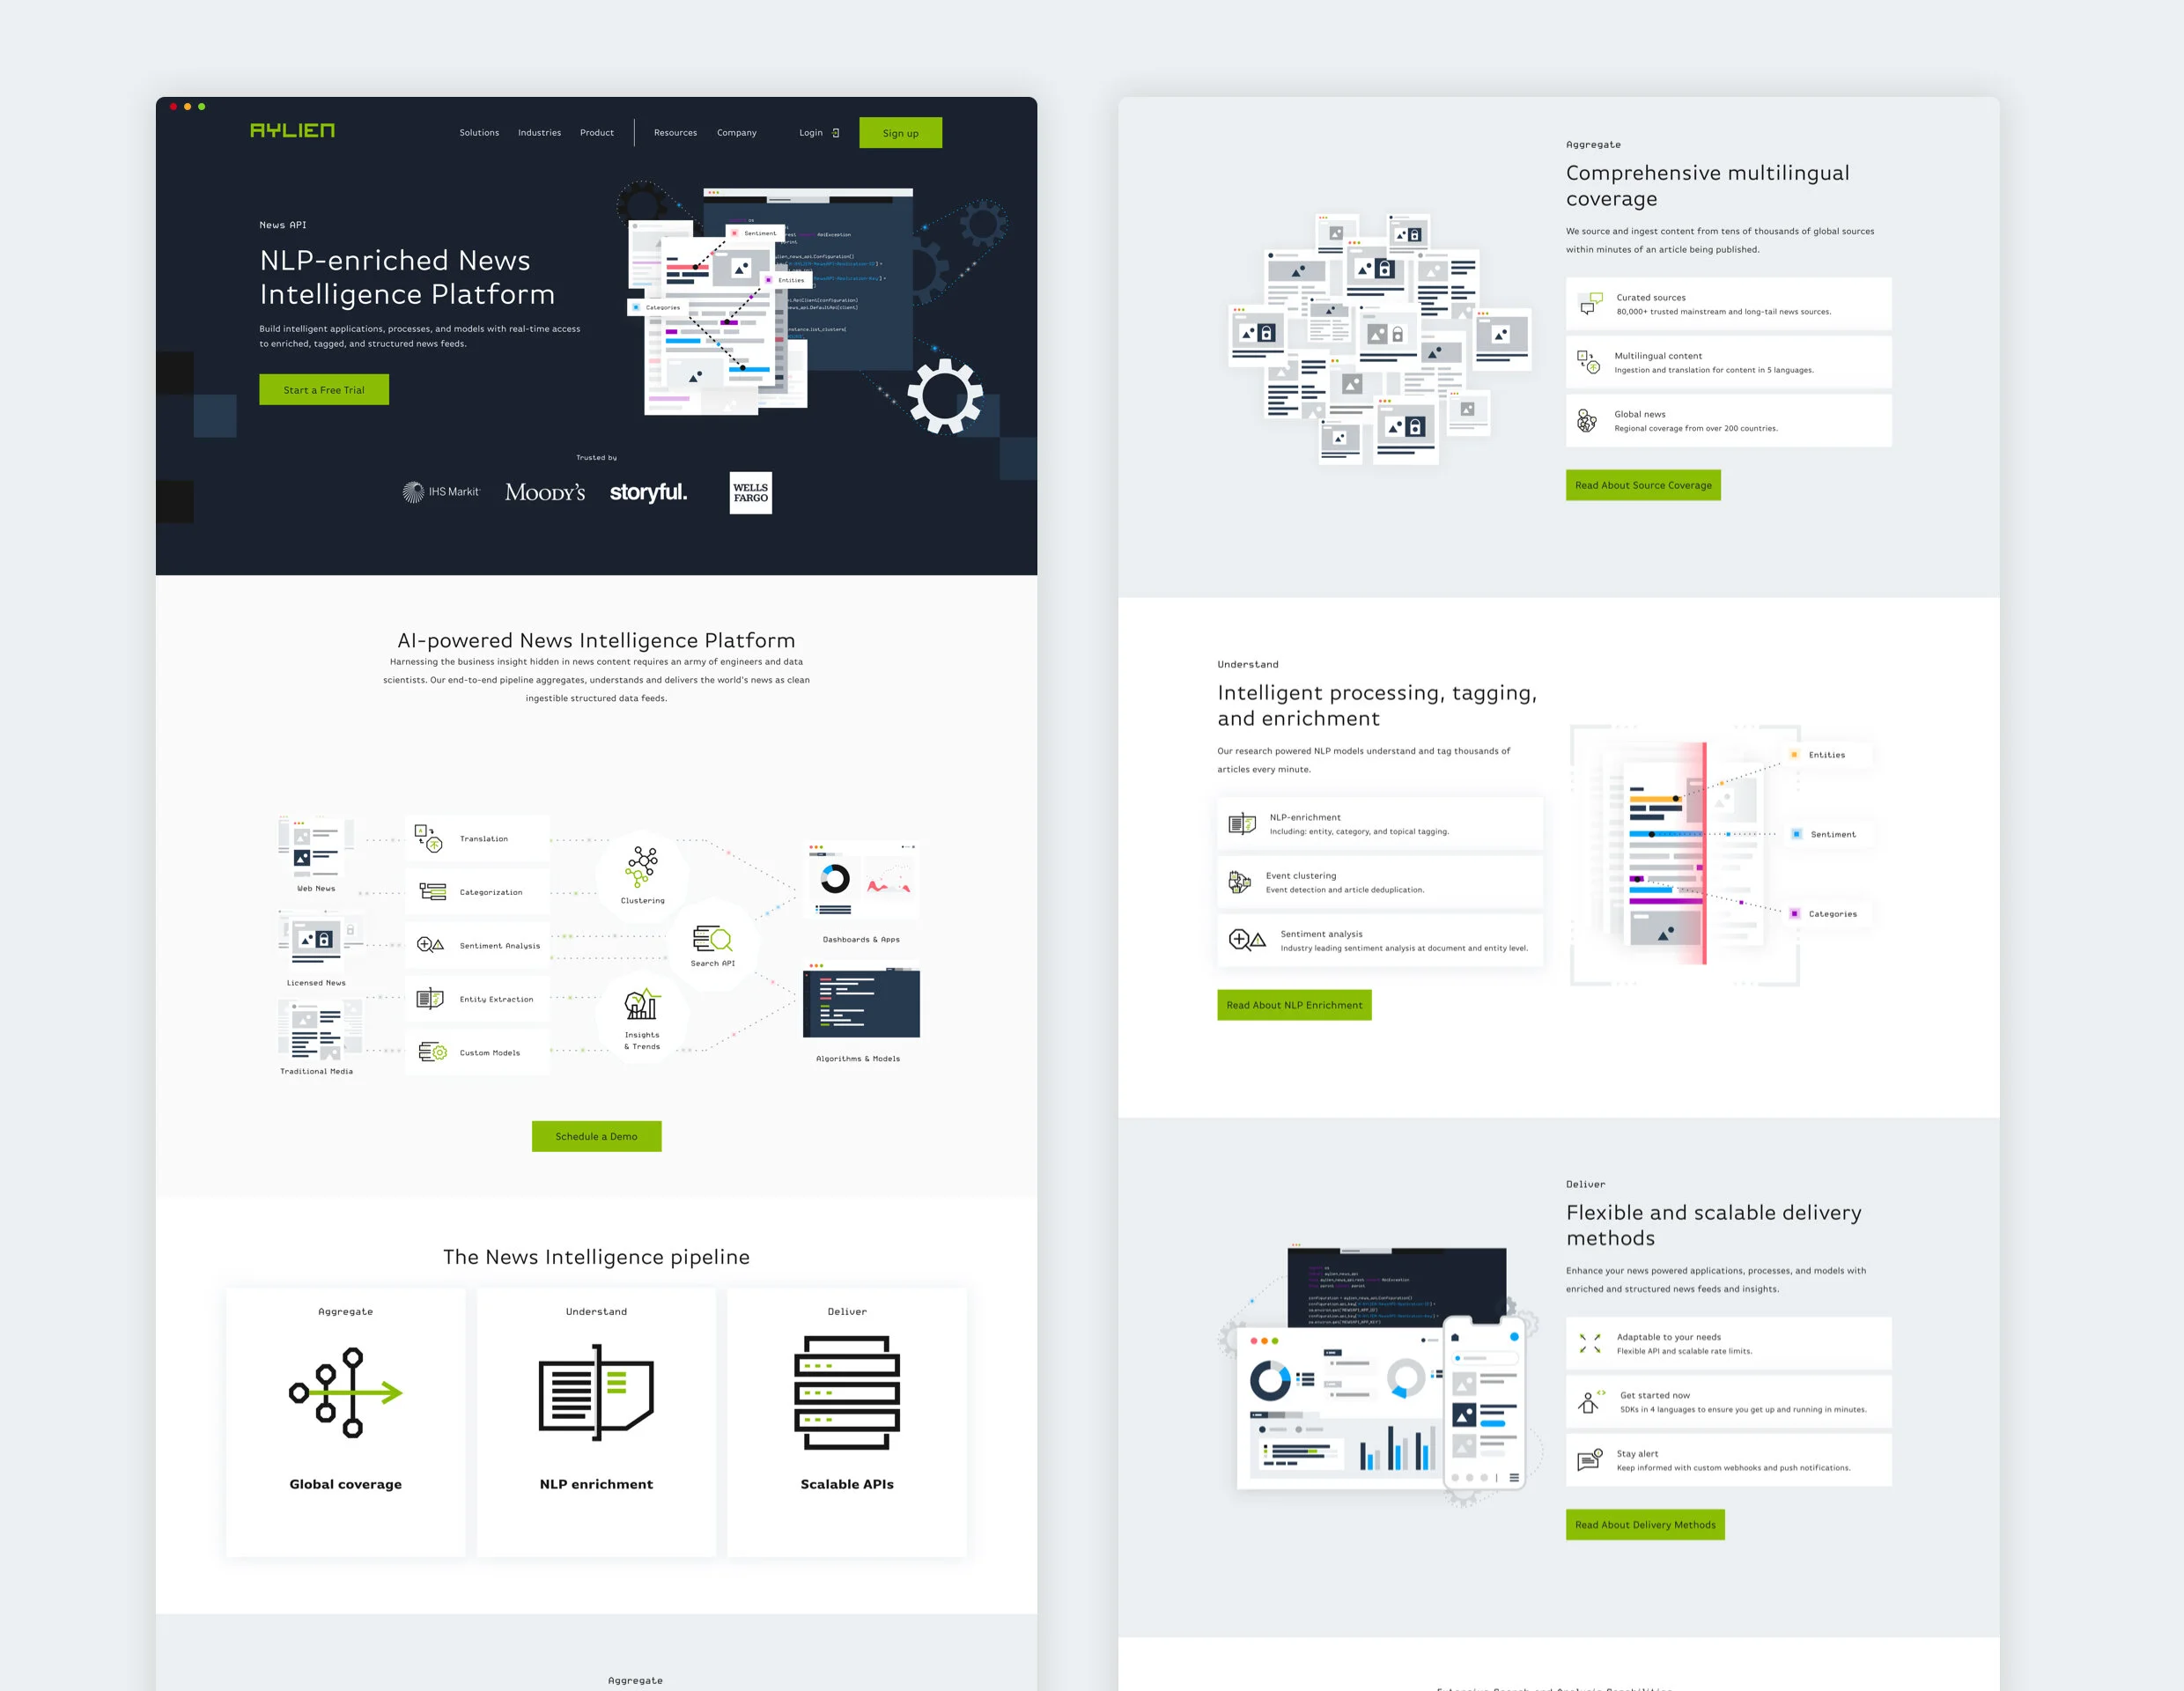
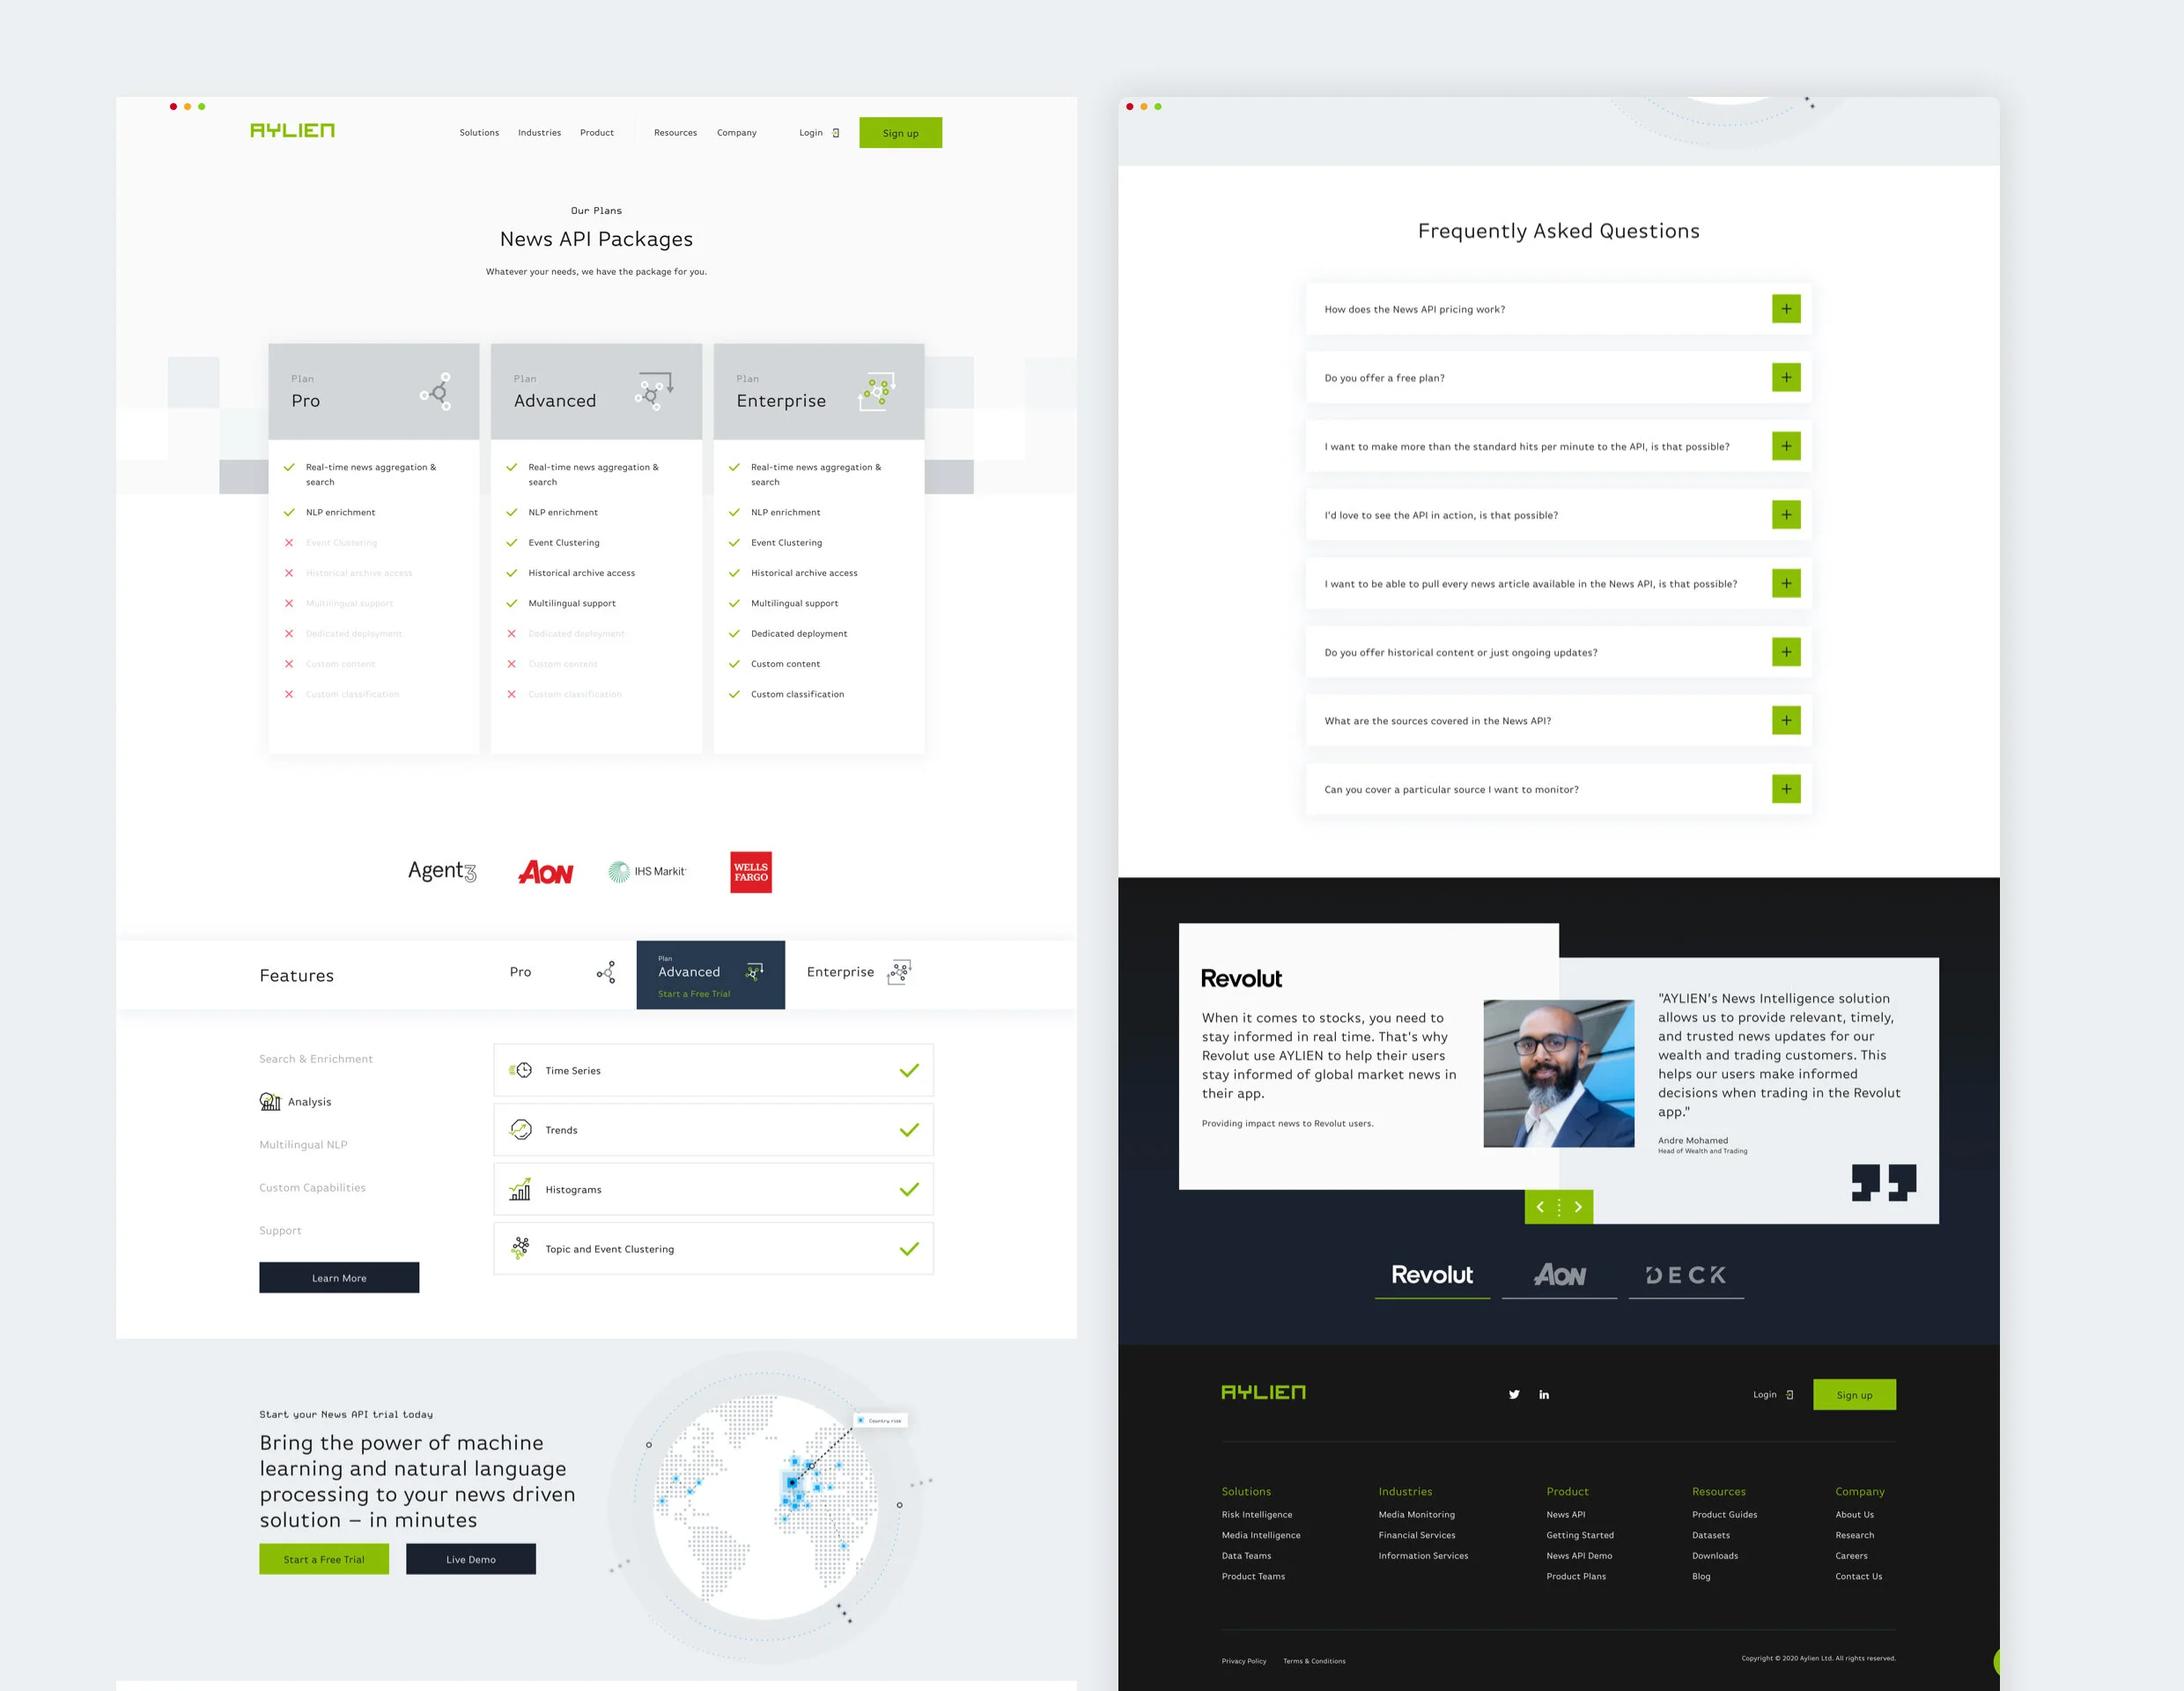
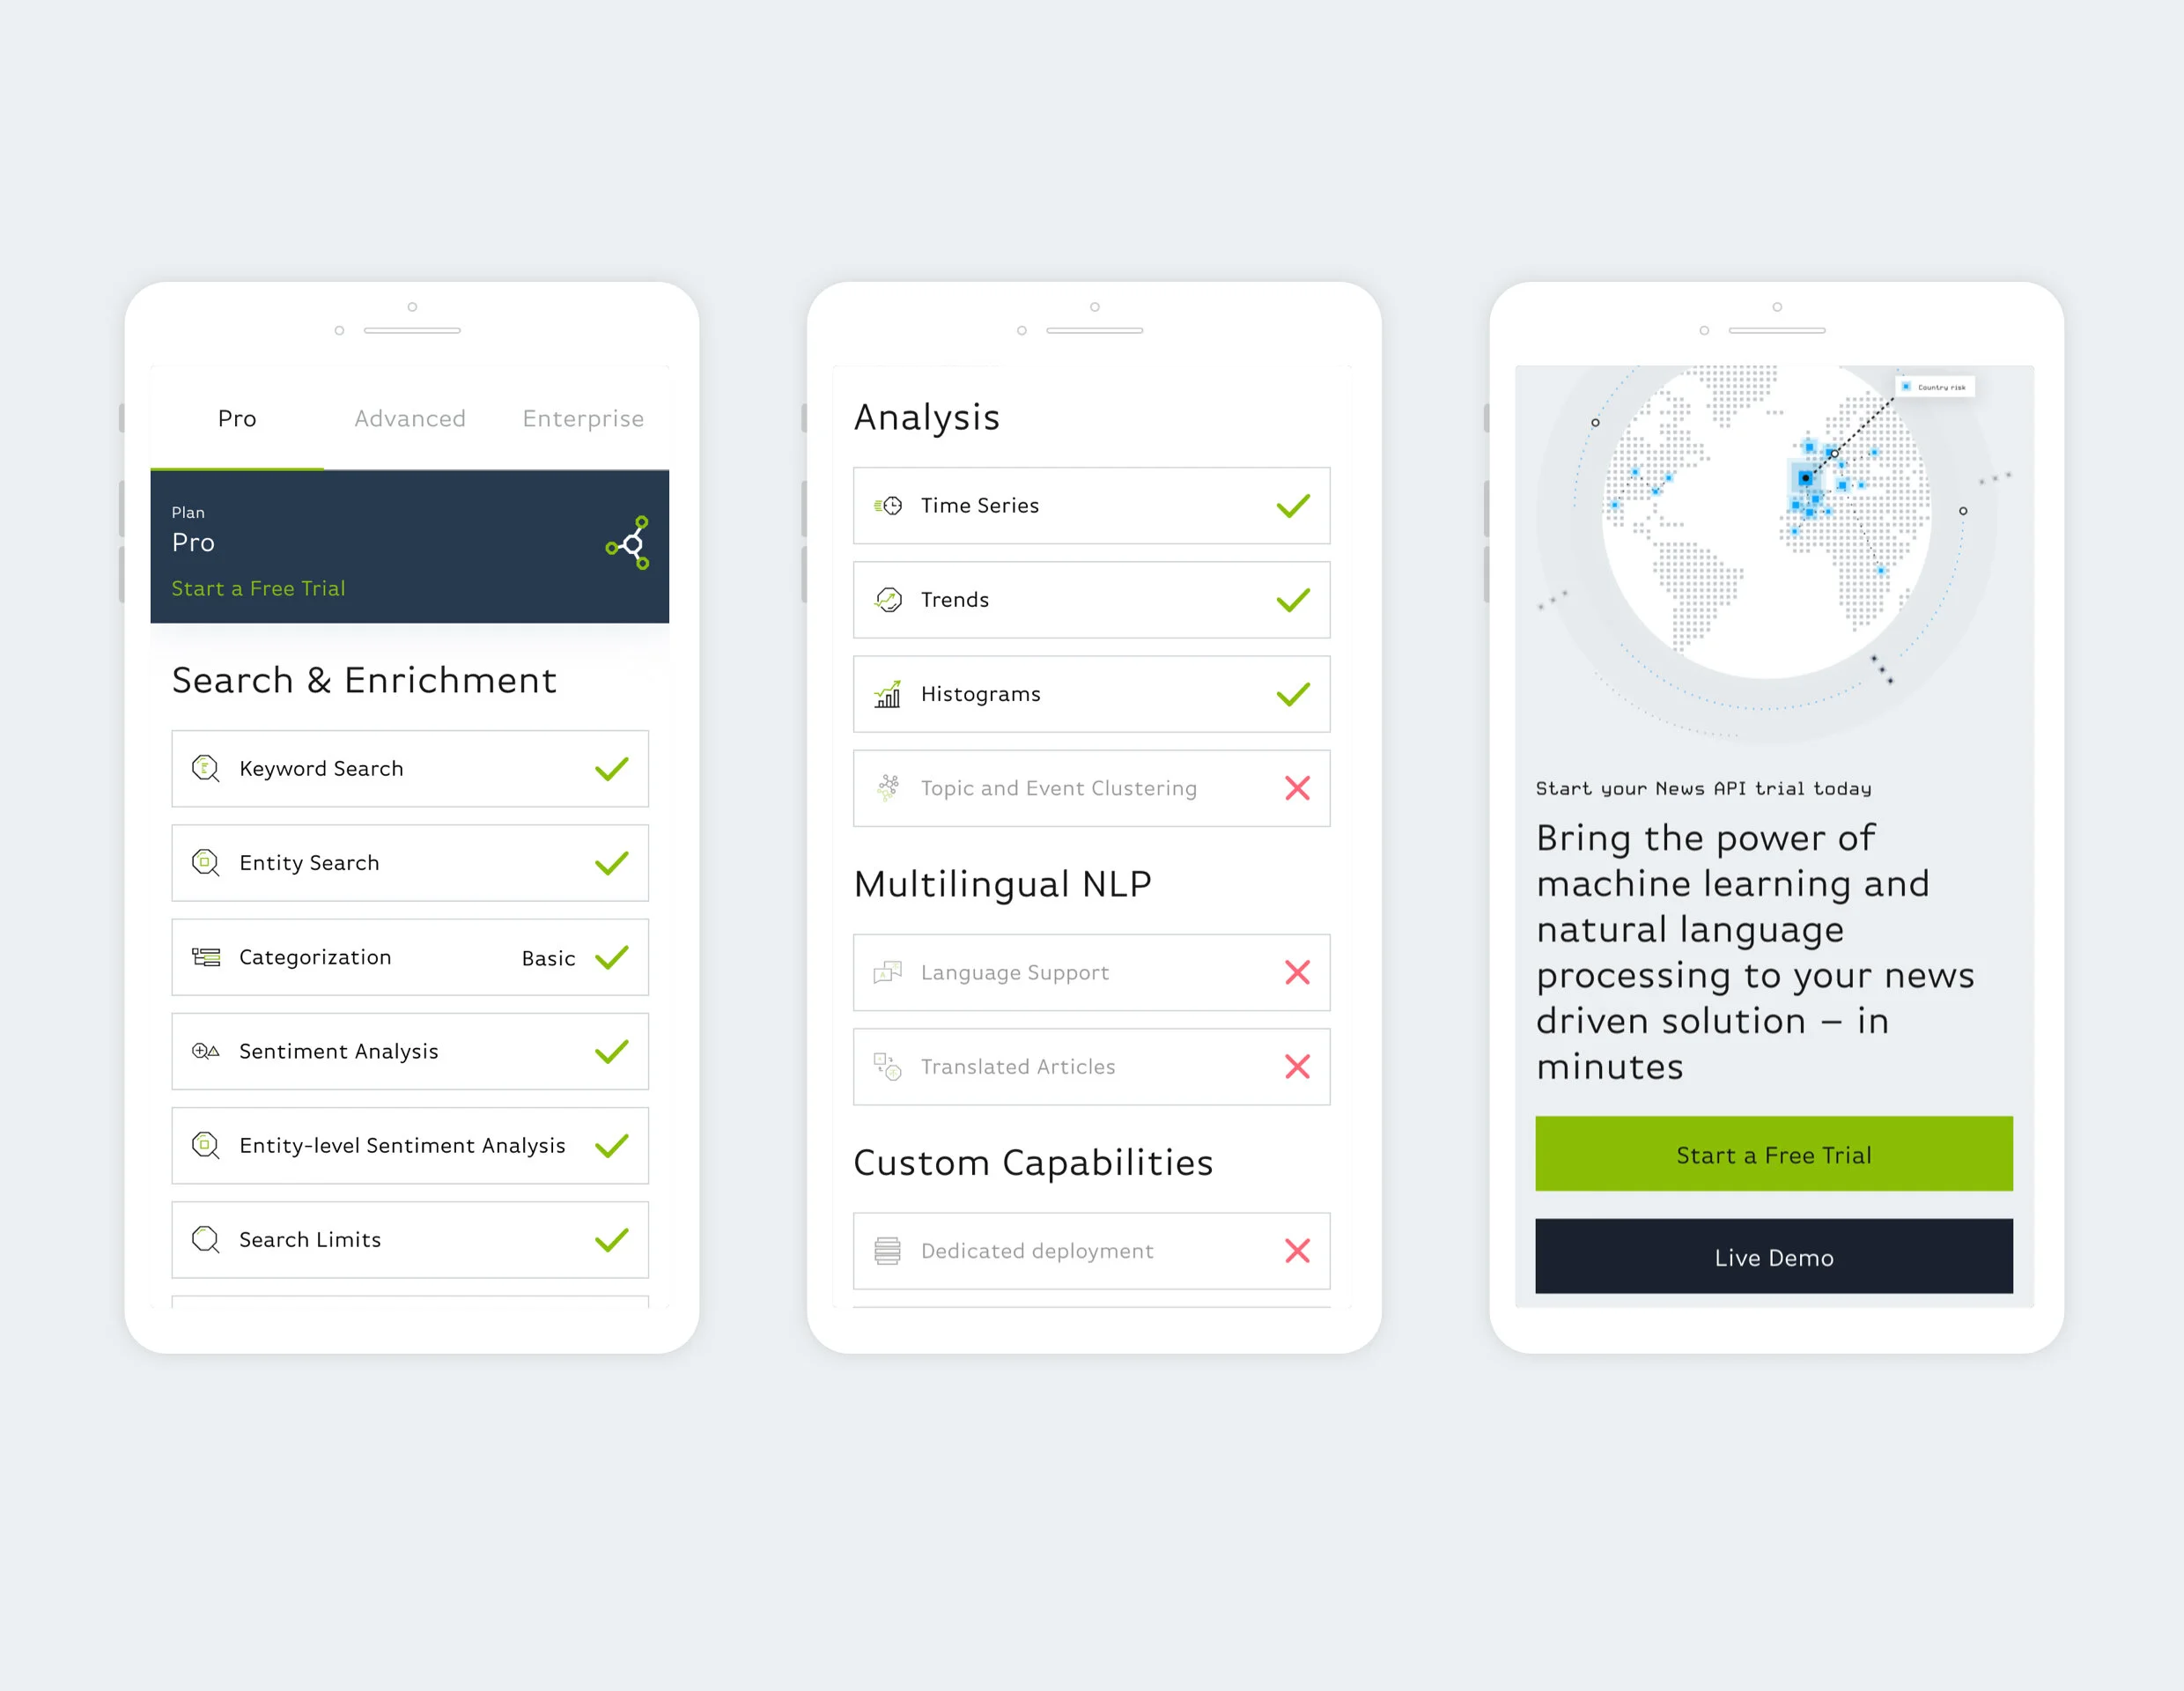
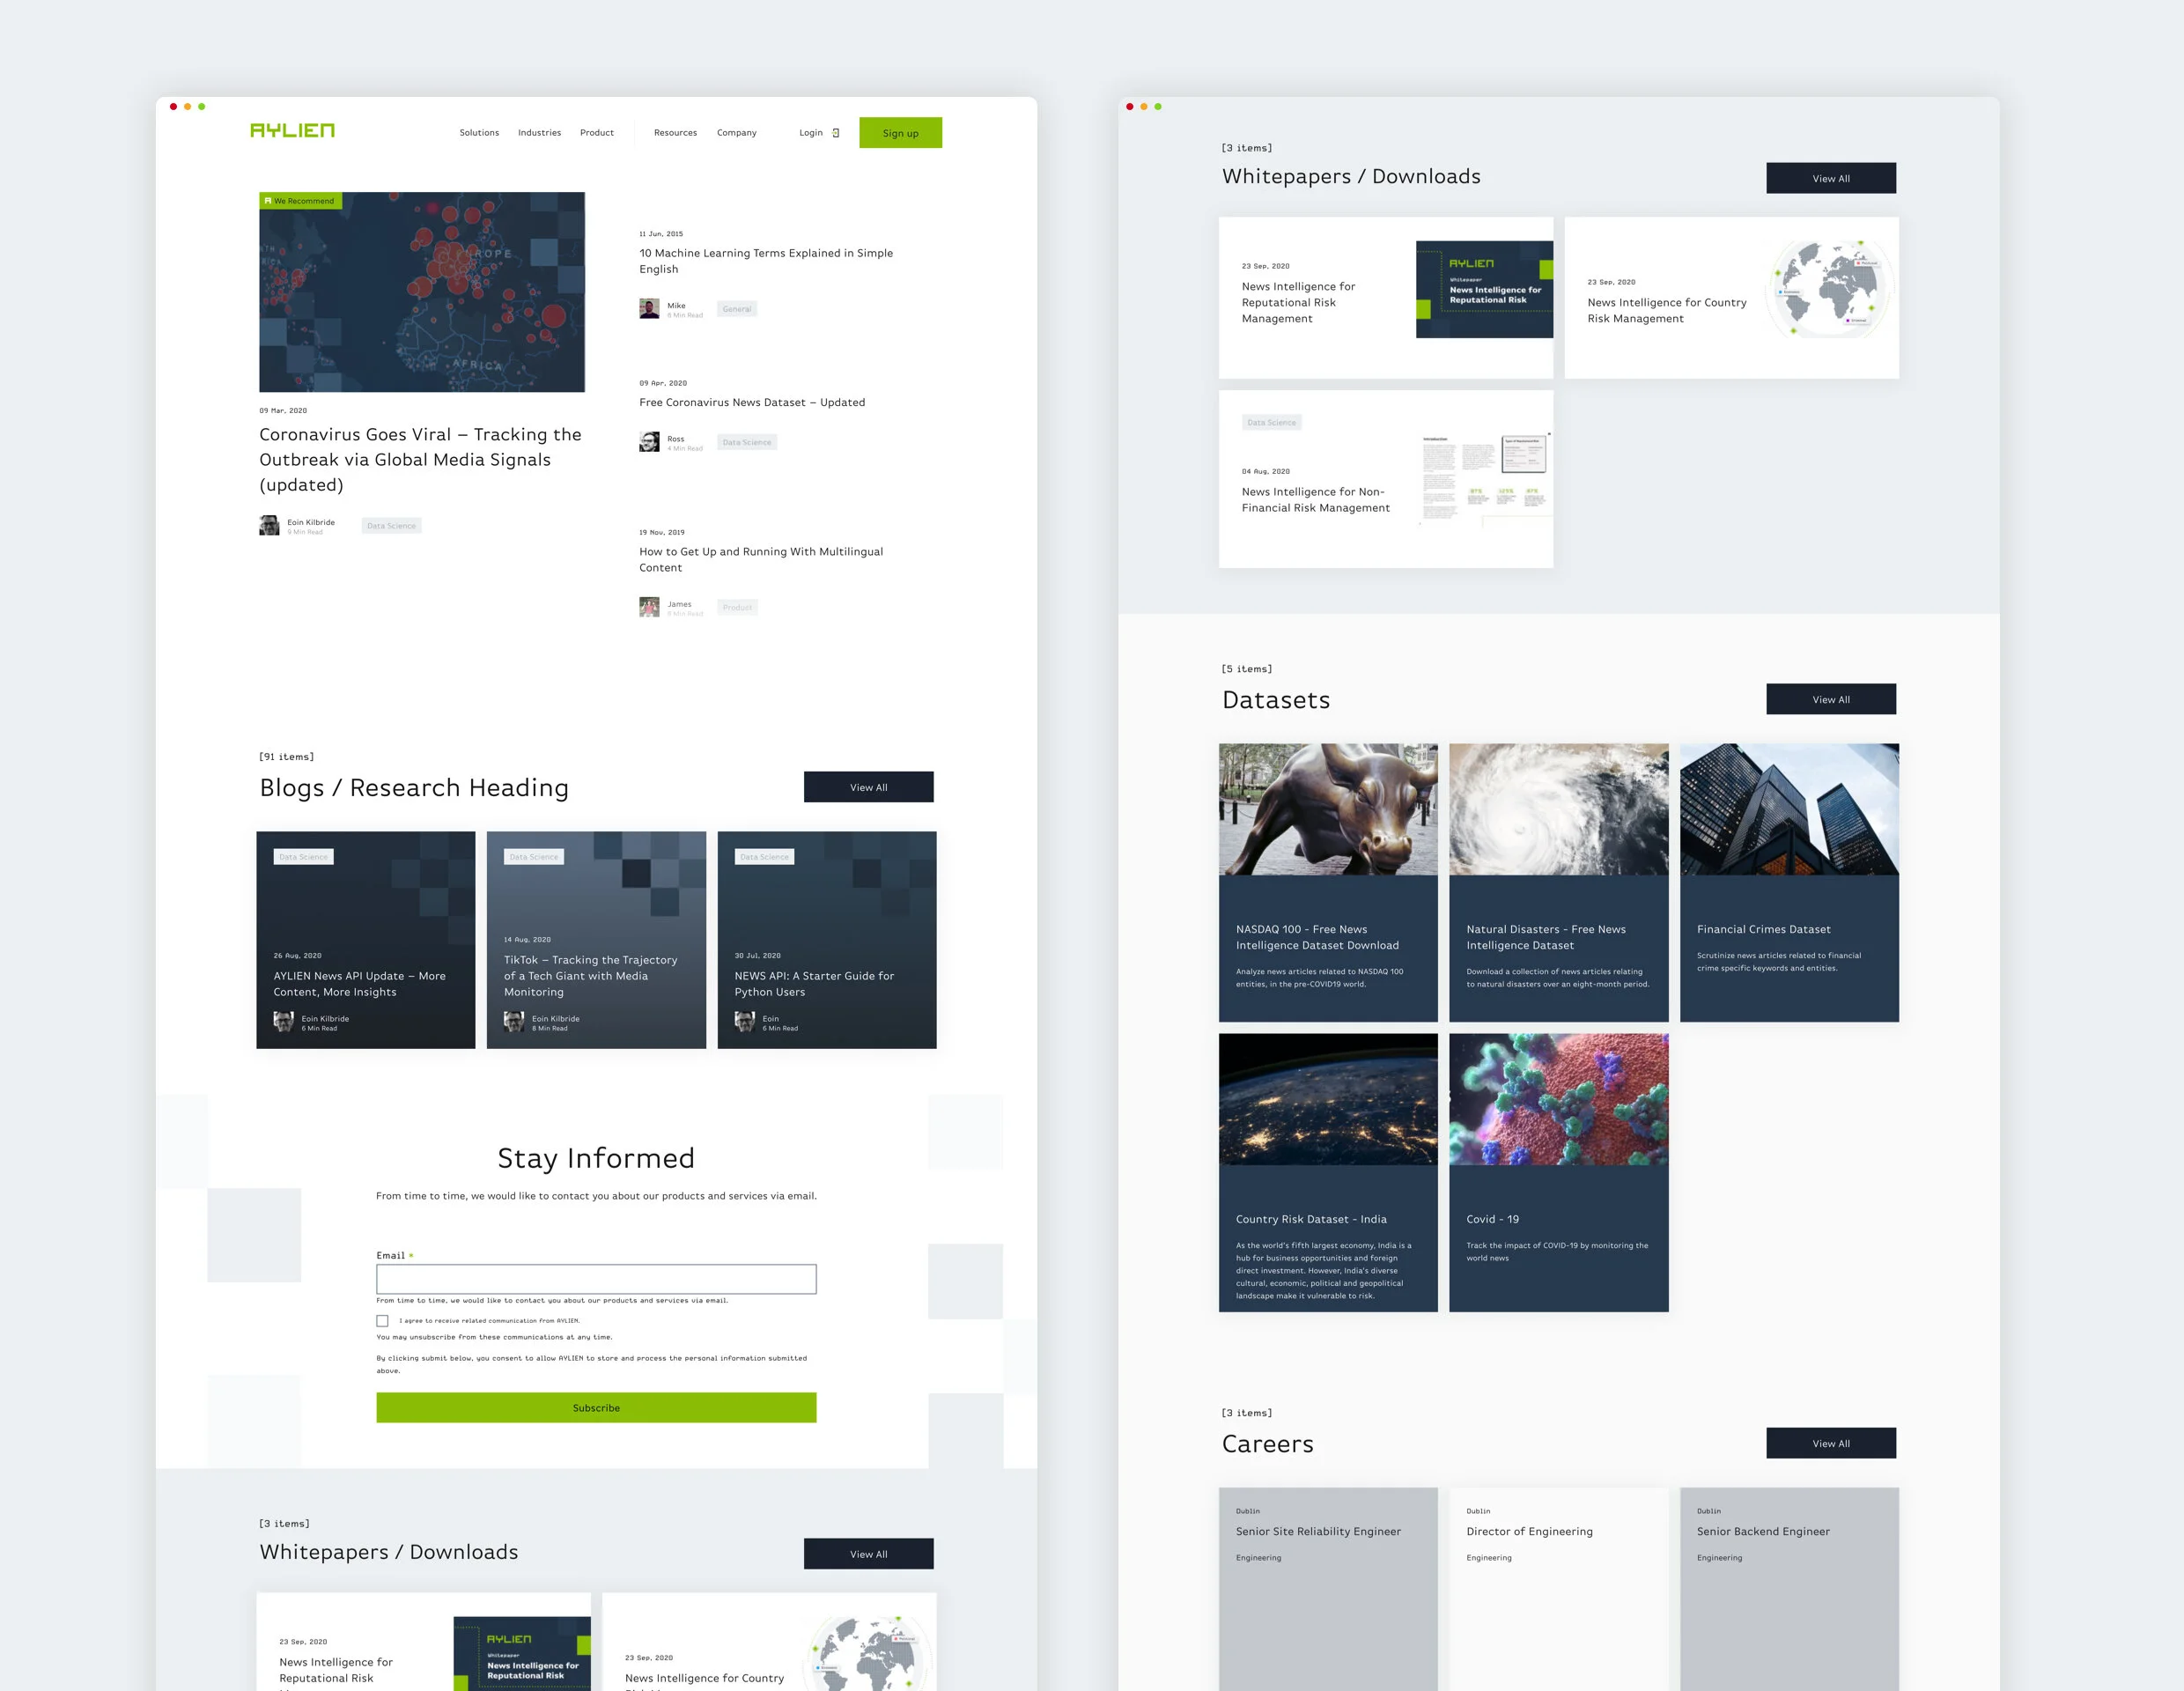
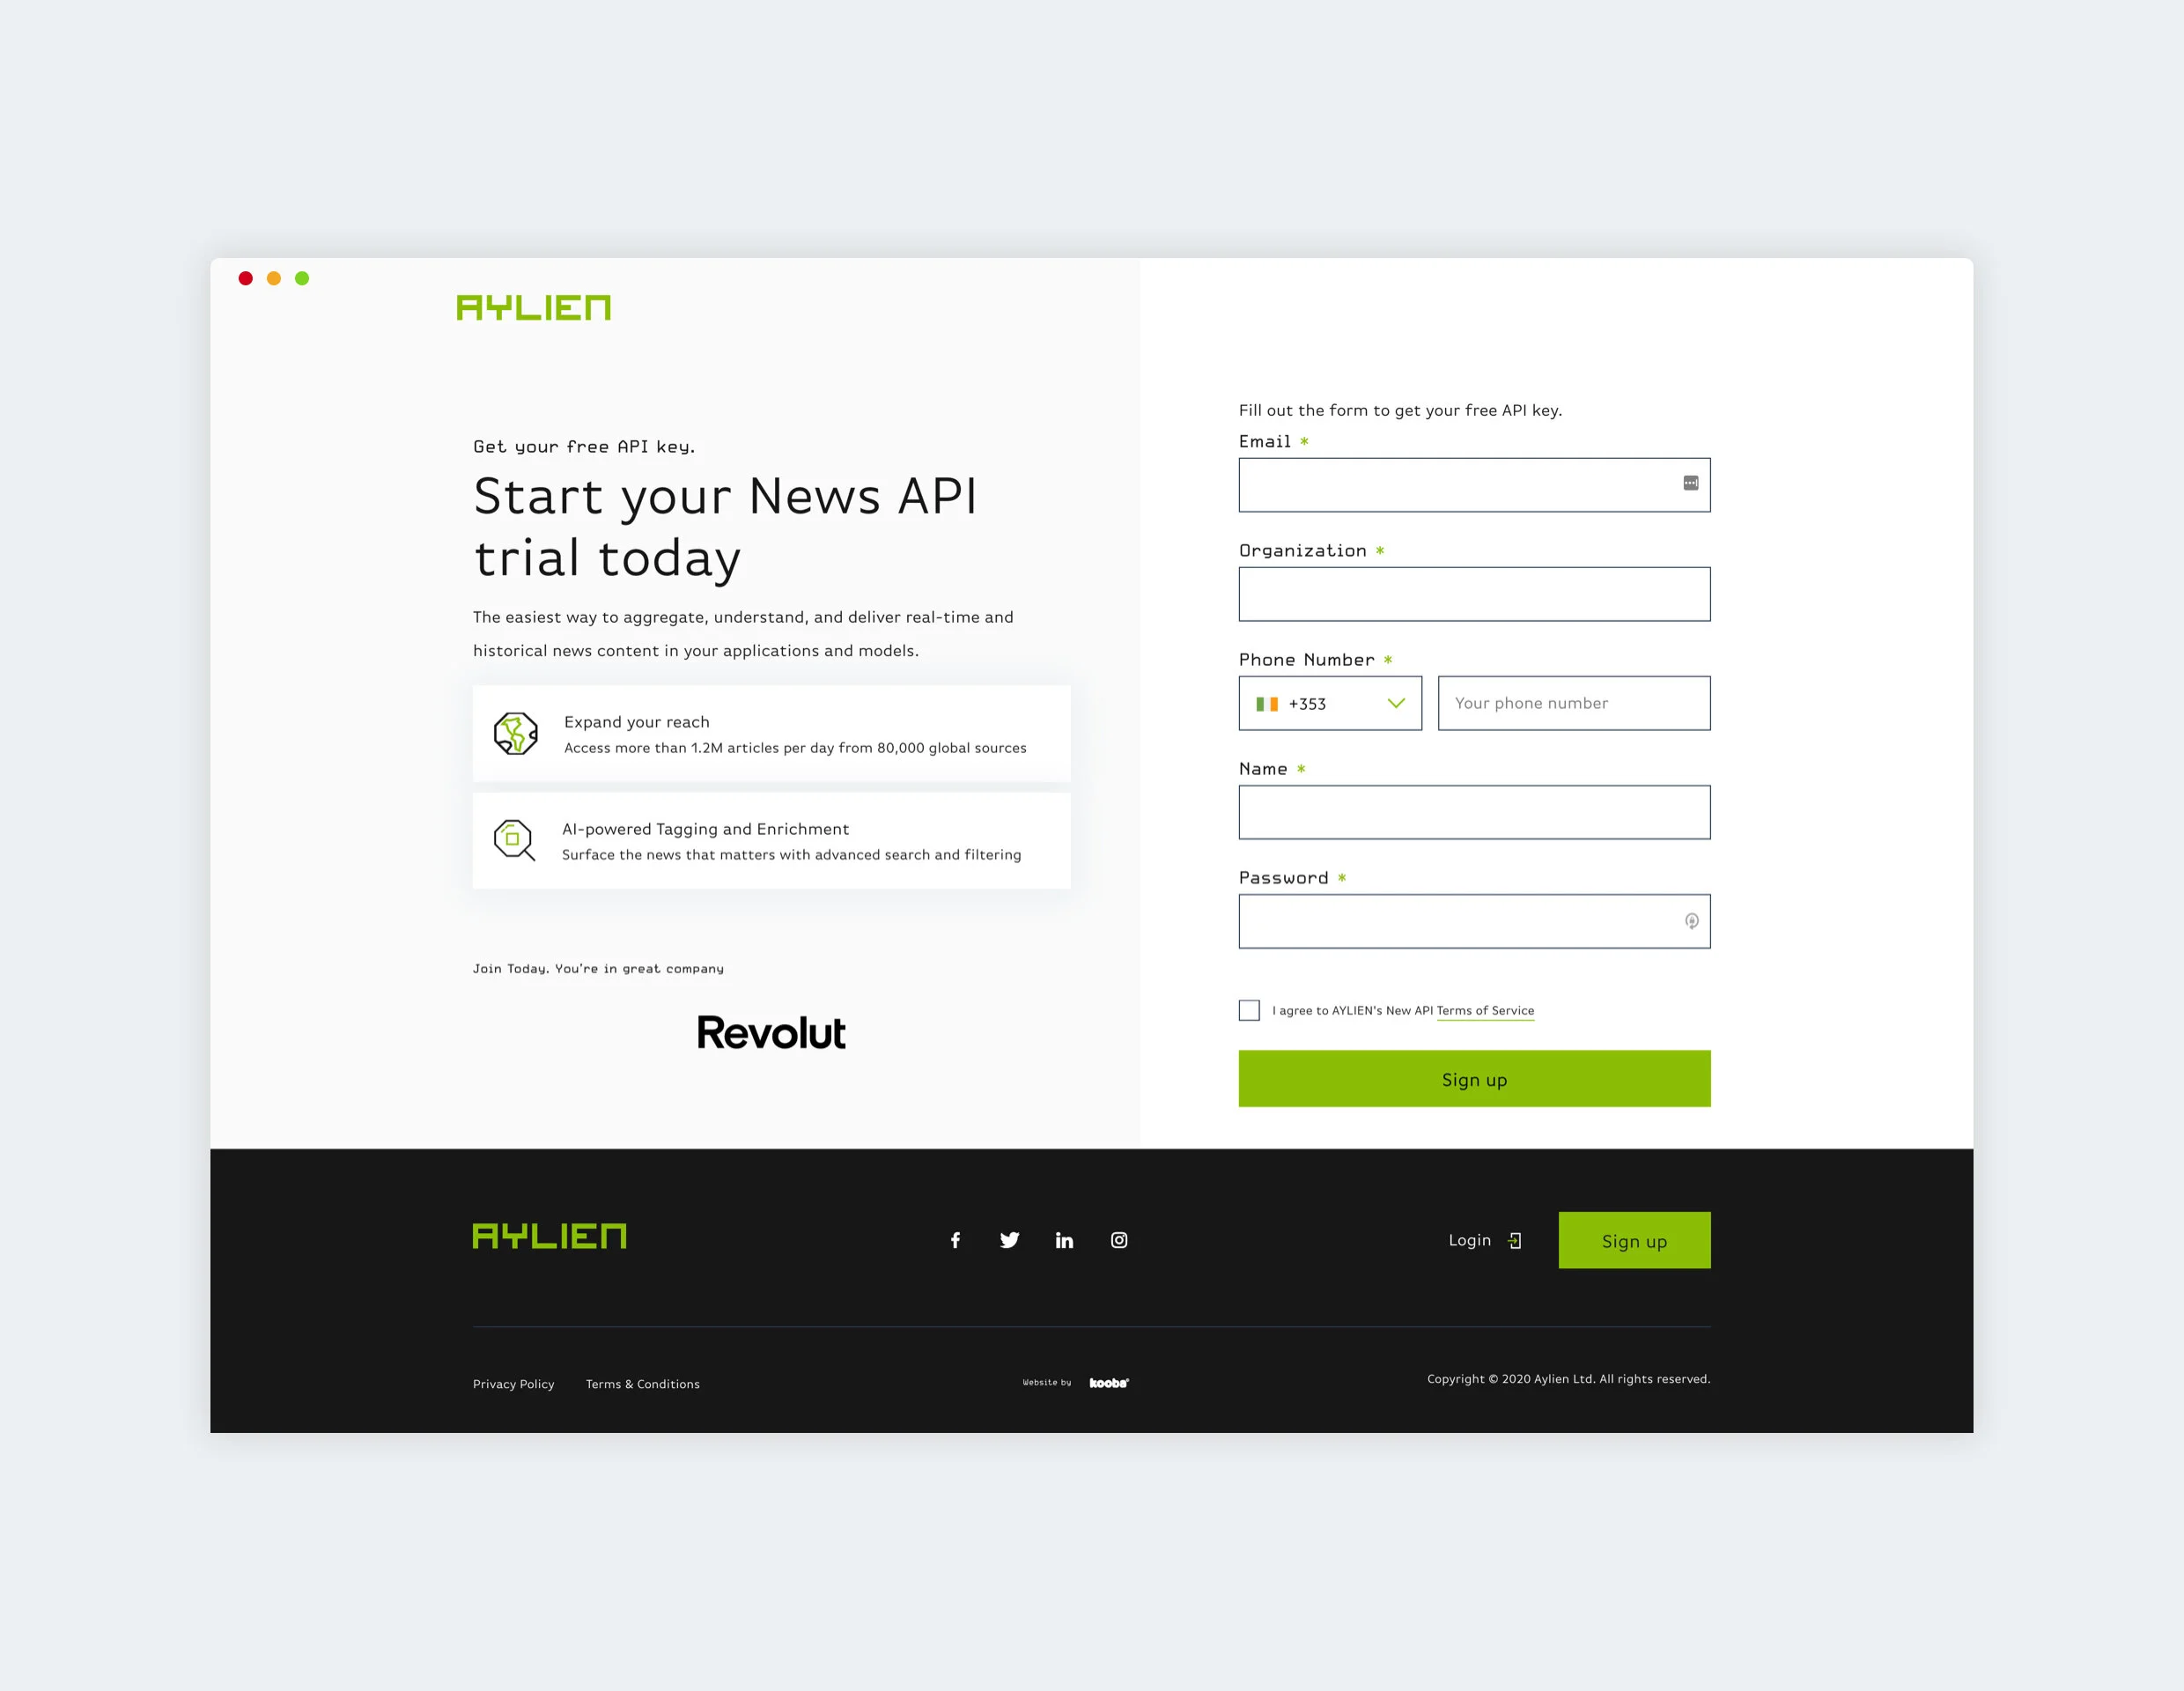
The new website had to ensure it reflected visually what the company did while also developing a new and consistent visual language. The goal at each touchpoint was to balance carefully explaining the product and features while ensuring the user had quick access to a demo or signing up.
Overall it was a big visual change for AYLIEN, but ultimately it brought them from a start-up look and feel to where they needed to be as industry leaders and target businesses.
Role
Lead Designer UX/UI and Illustrations
Live Website
Completed while working at kooba
Analysis
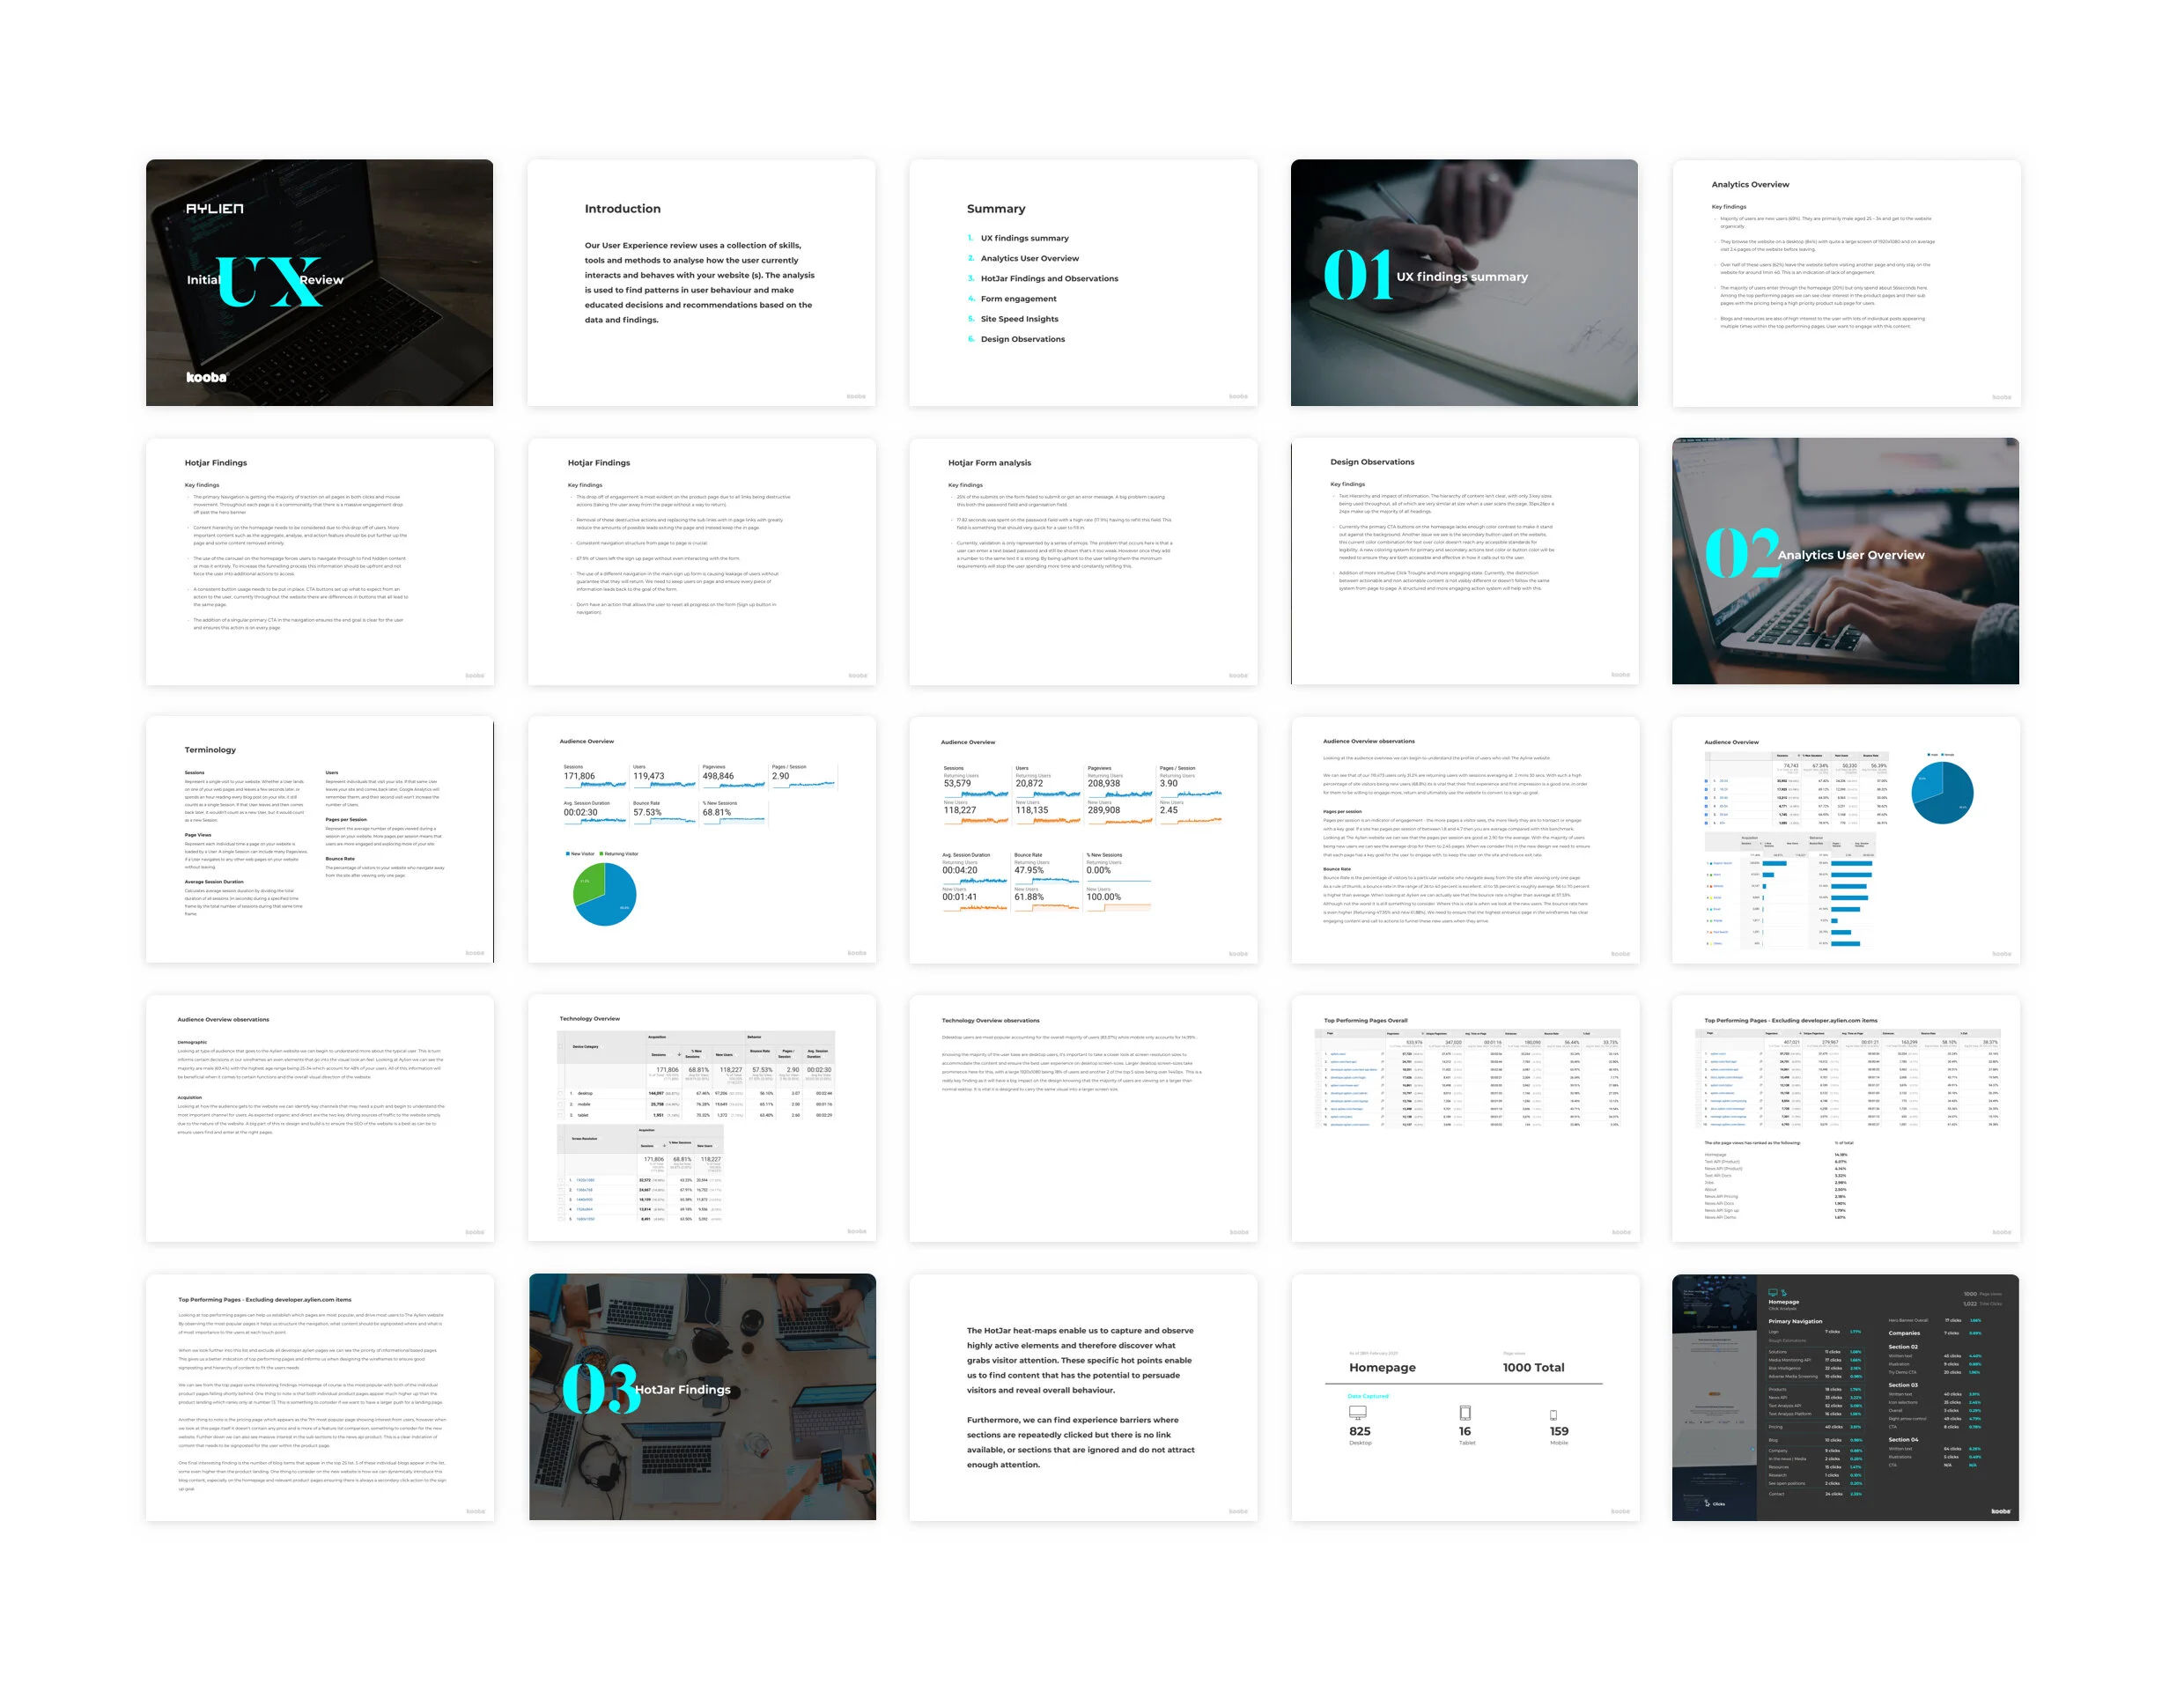
Full analytics review
Current site performance
Current site pain points
Better user understanding and initial persona building data
Behavioural flow insights and user journey analysis
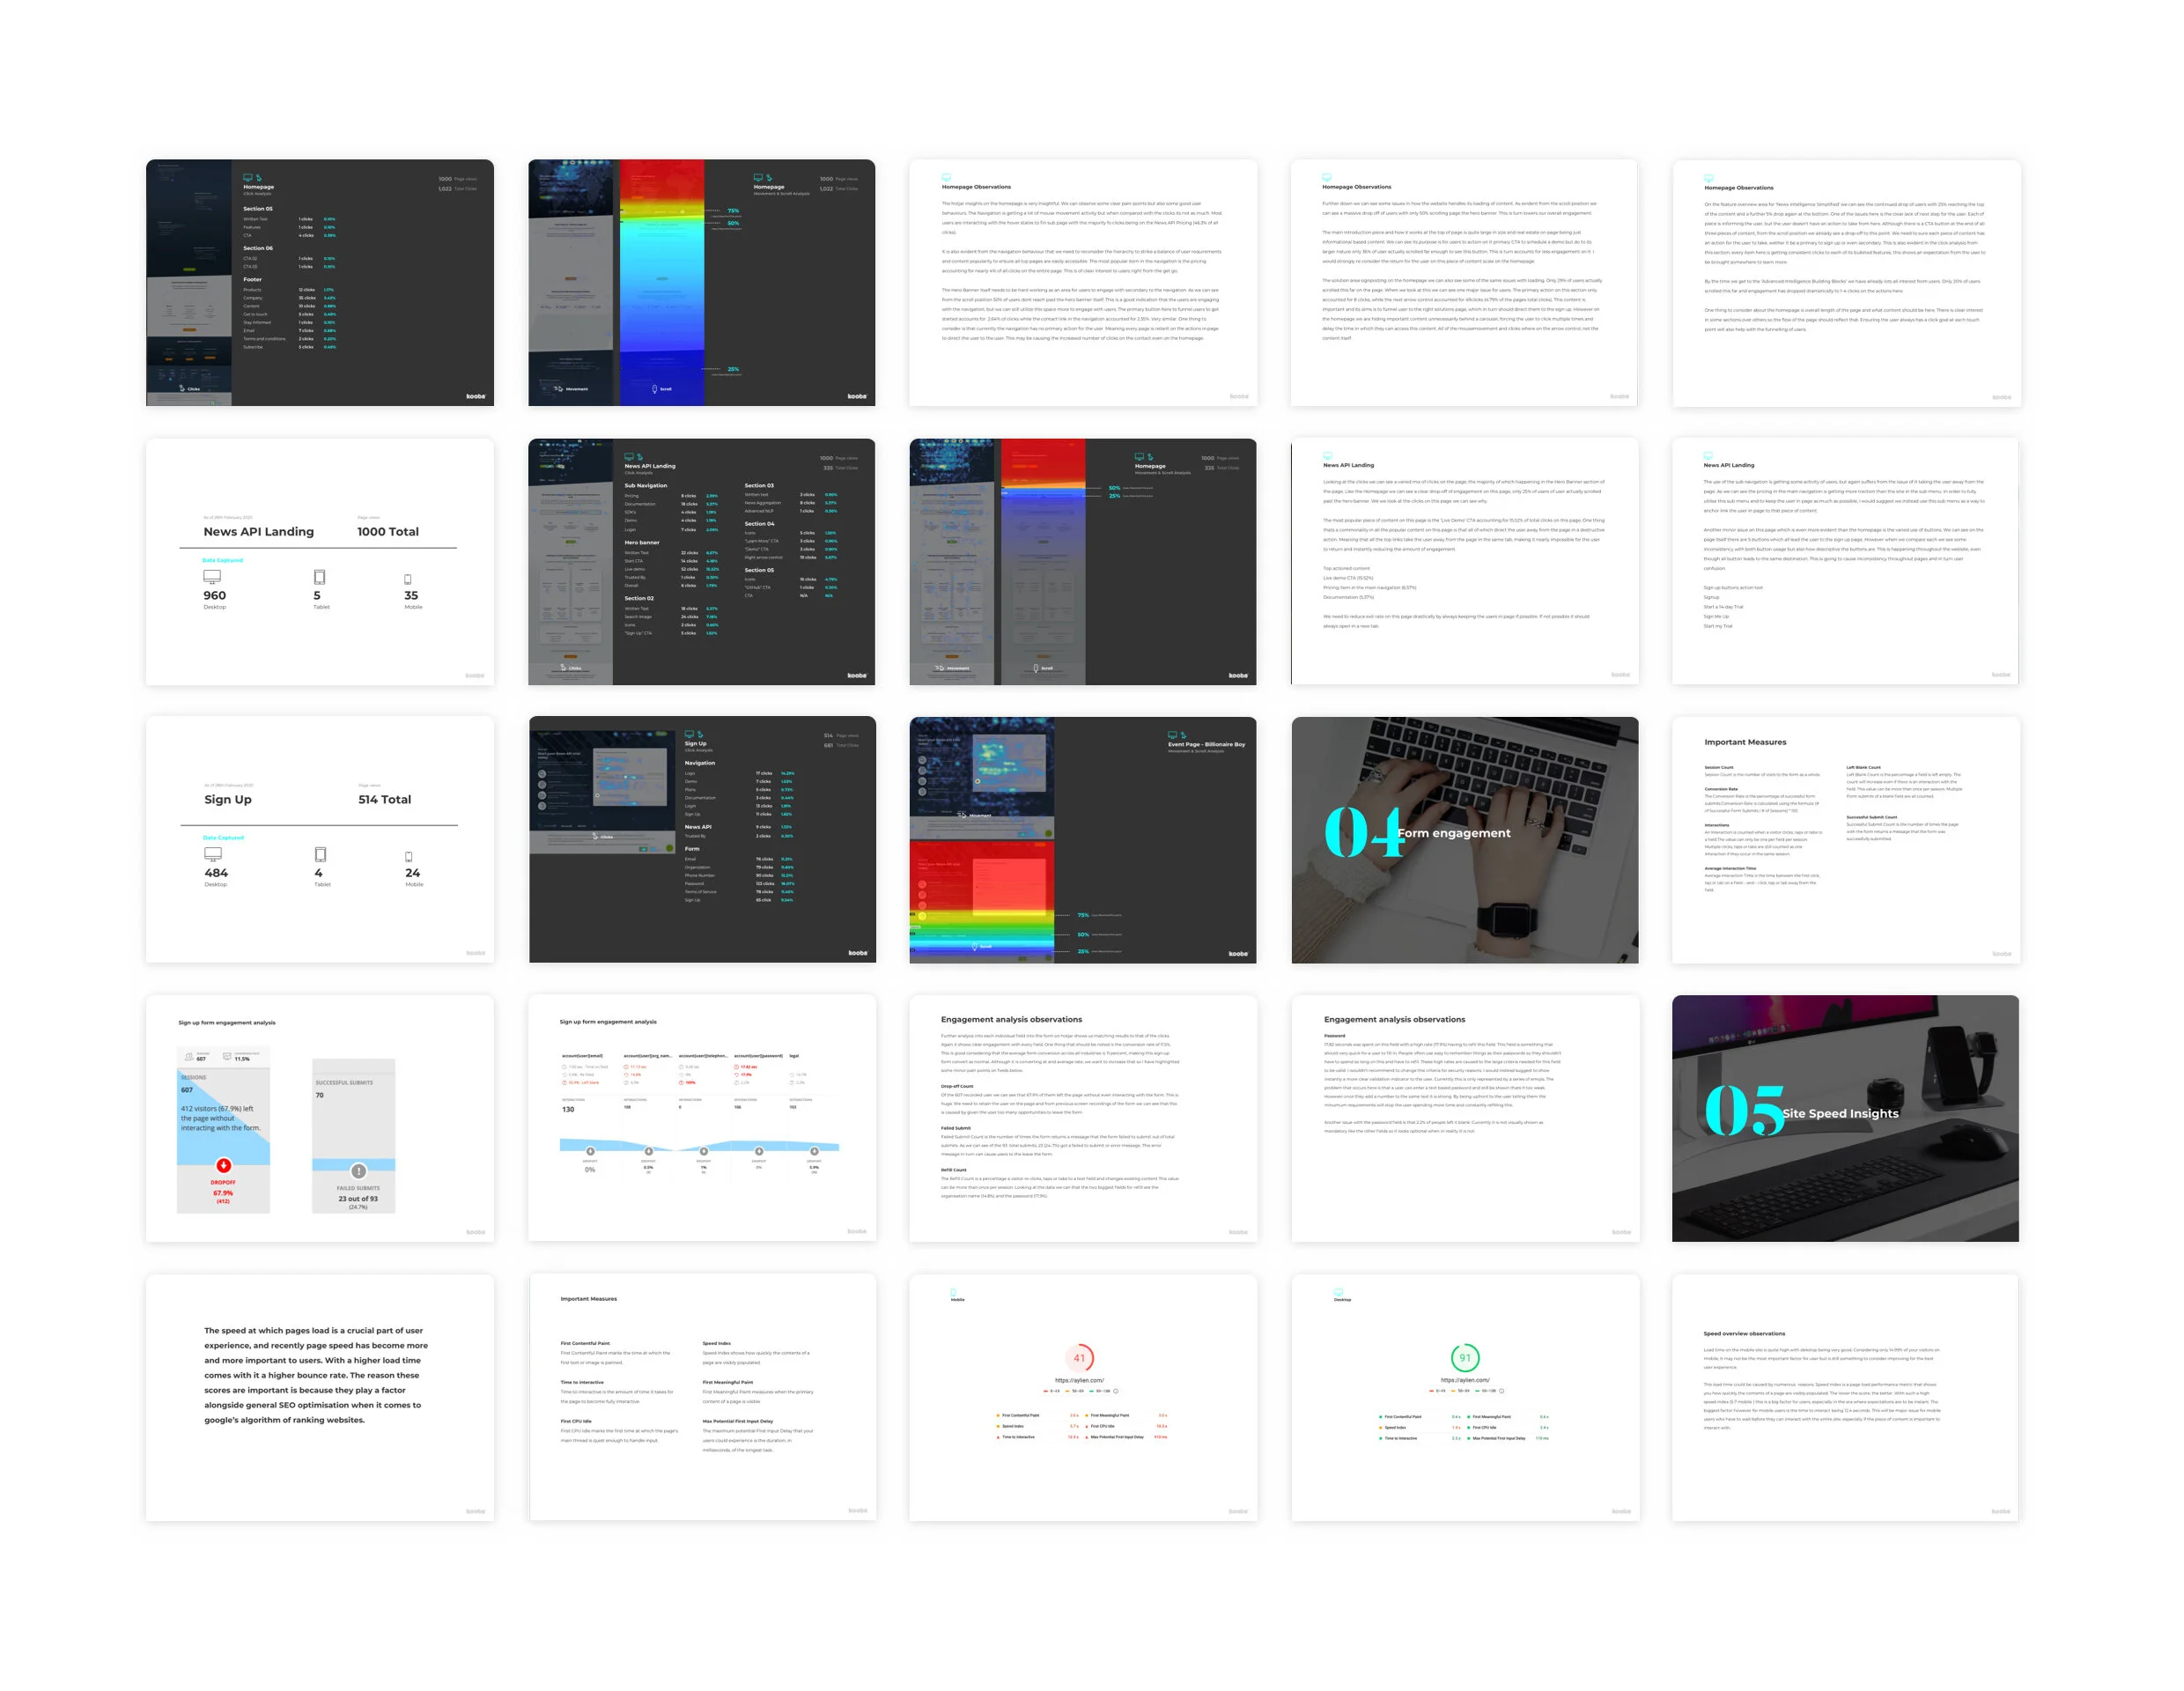
Hotjar Review
Key pages real-life data and behaviour review in conjunction with analytics
Similar Organisations review
Full review of current website based on findings from analytics and hotjar.
Page pain points
Best practices not upheld
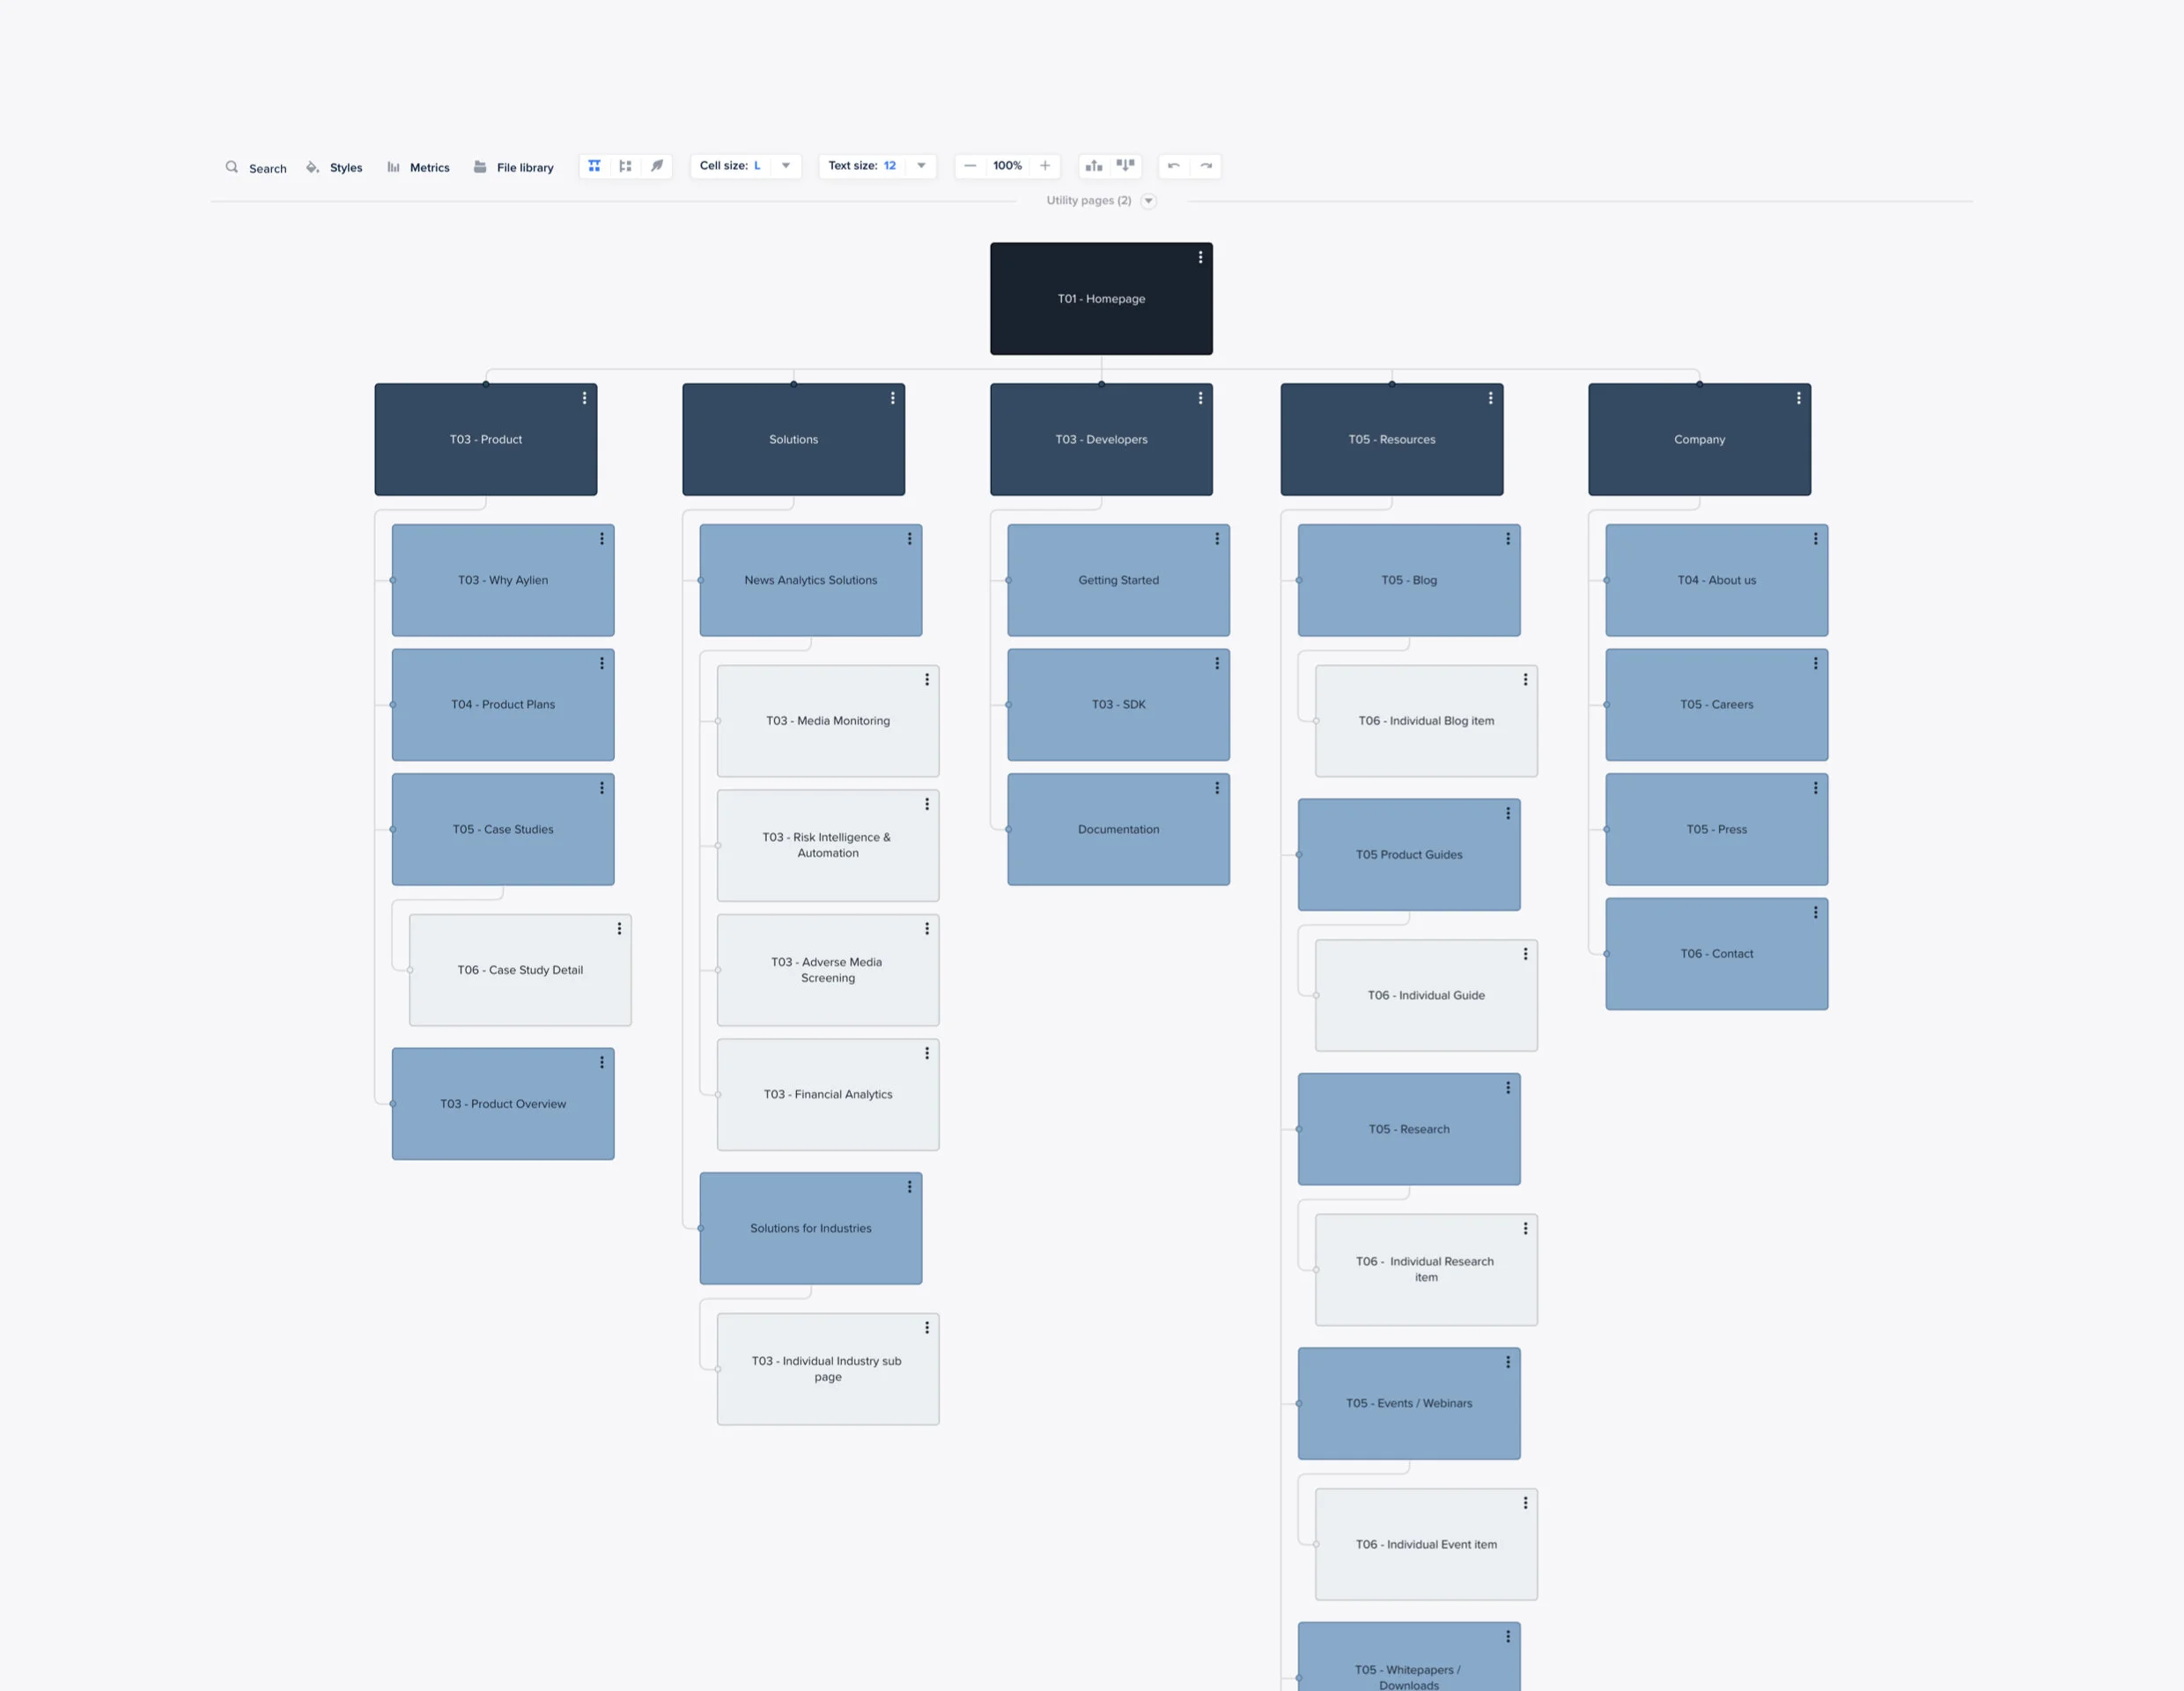
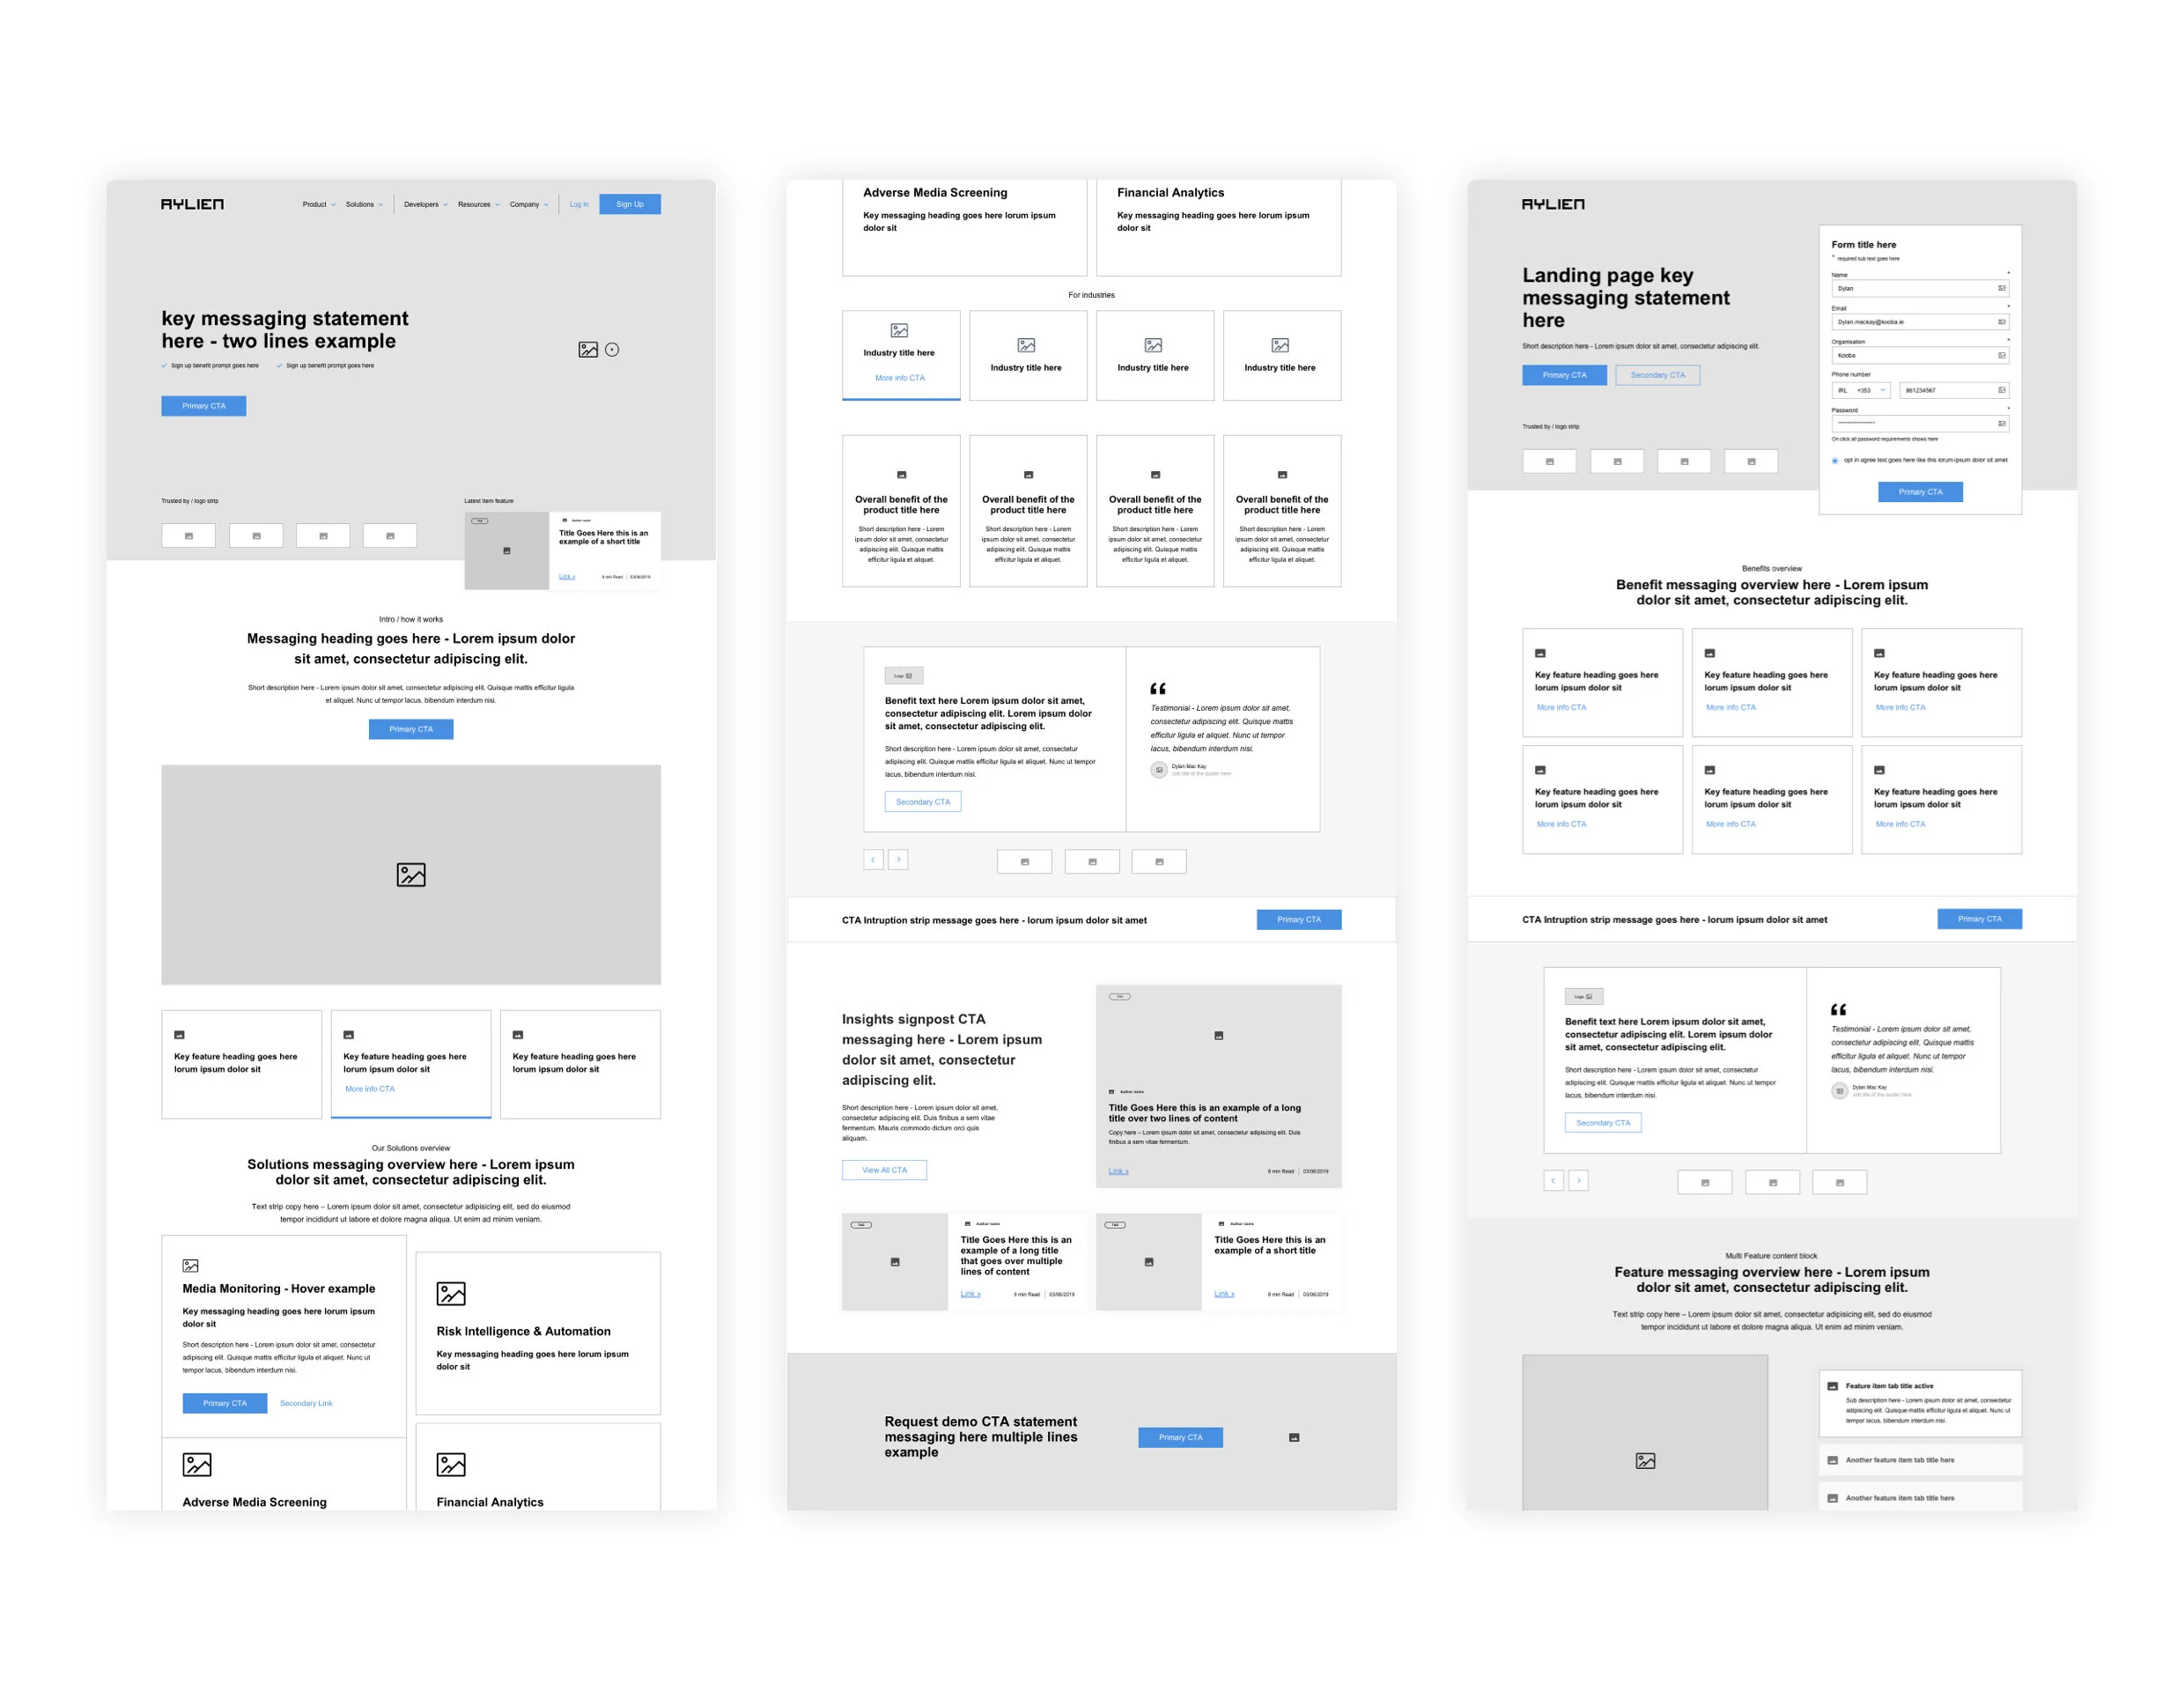
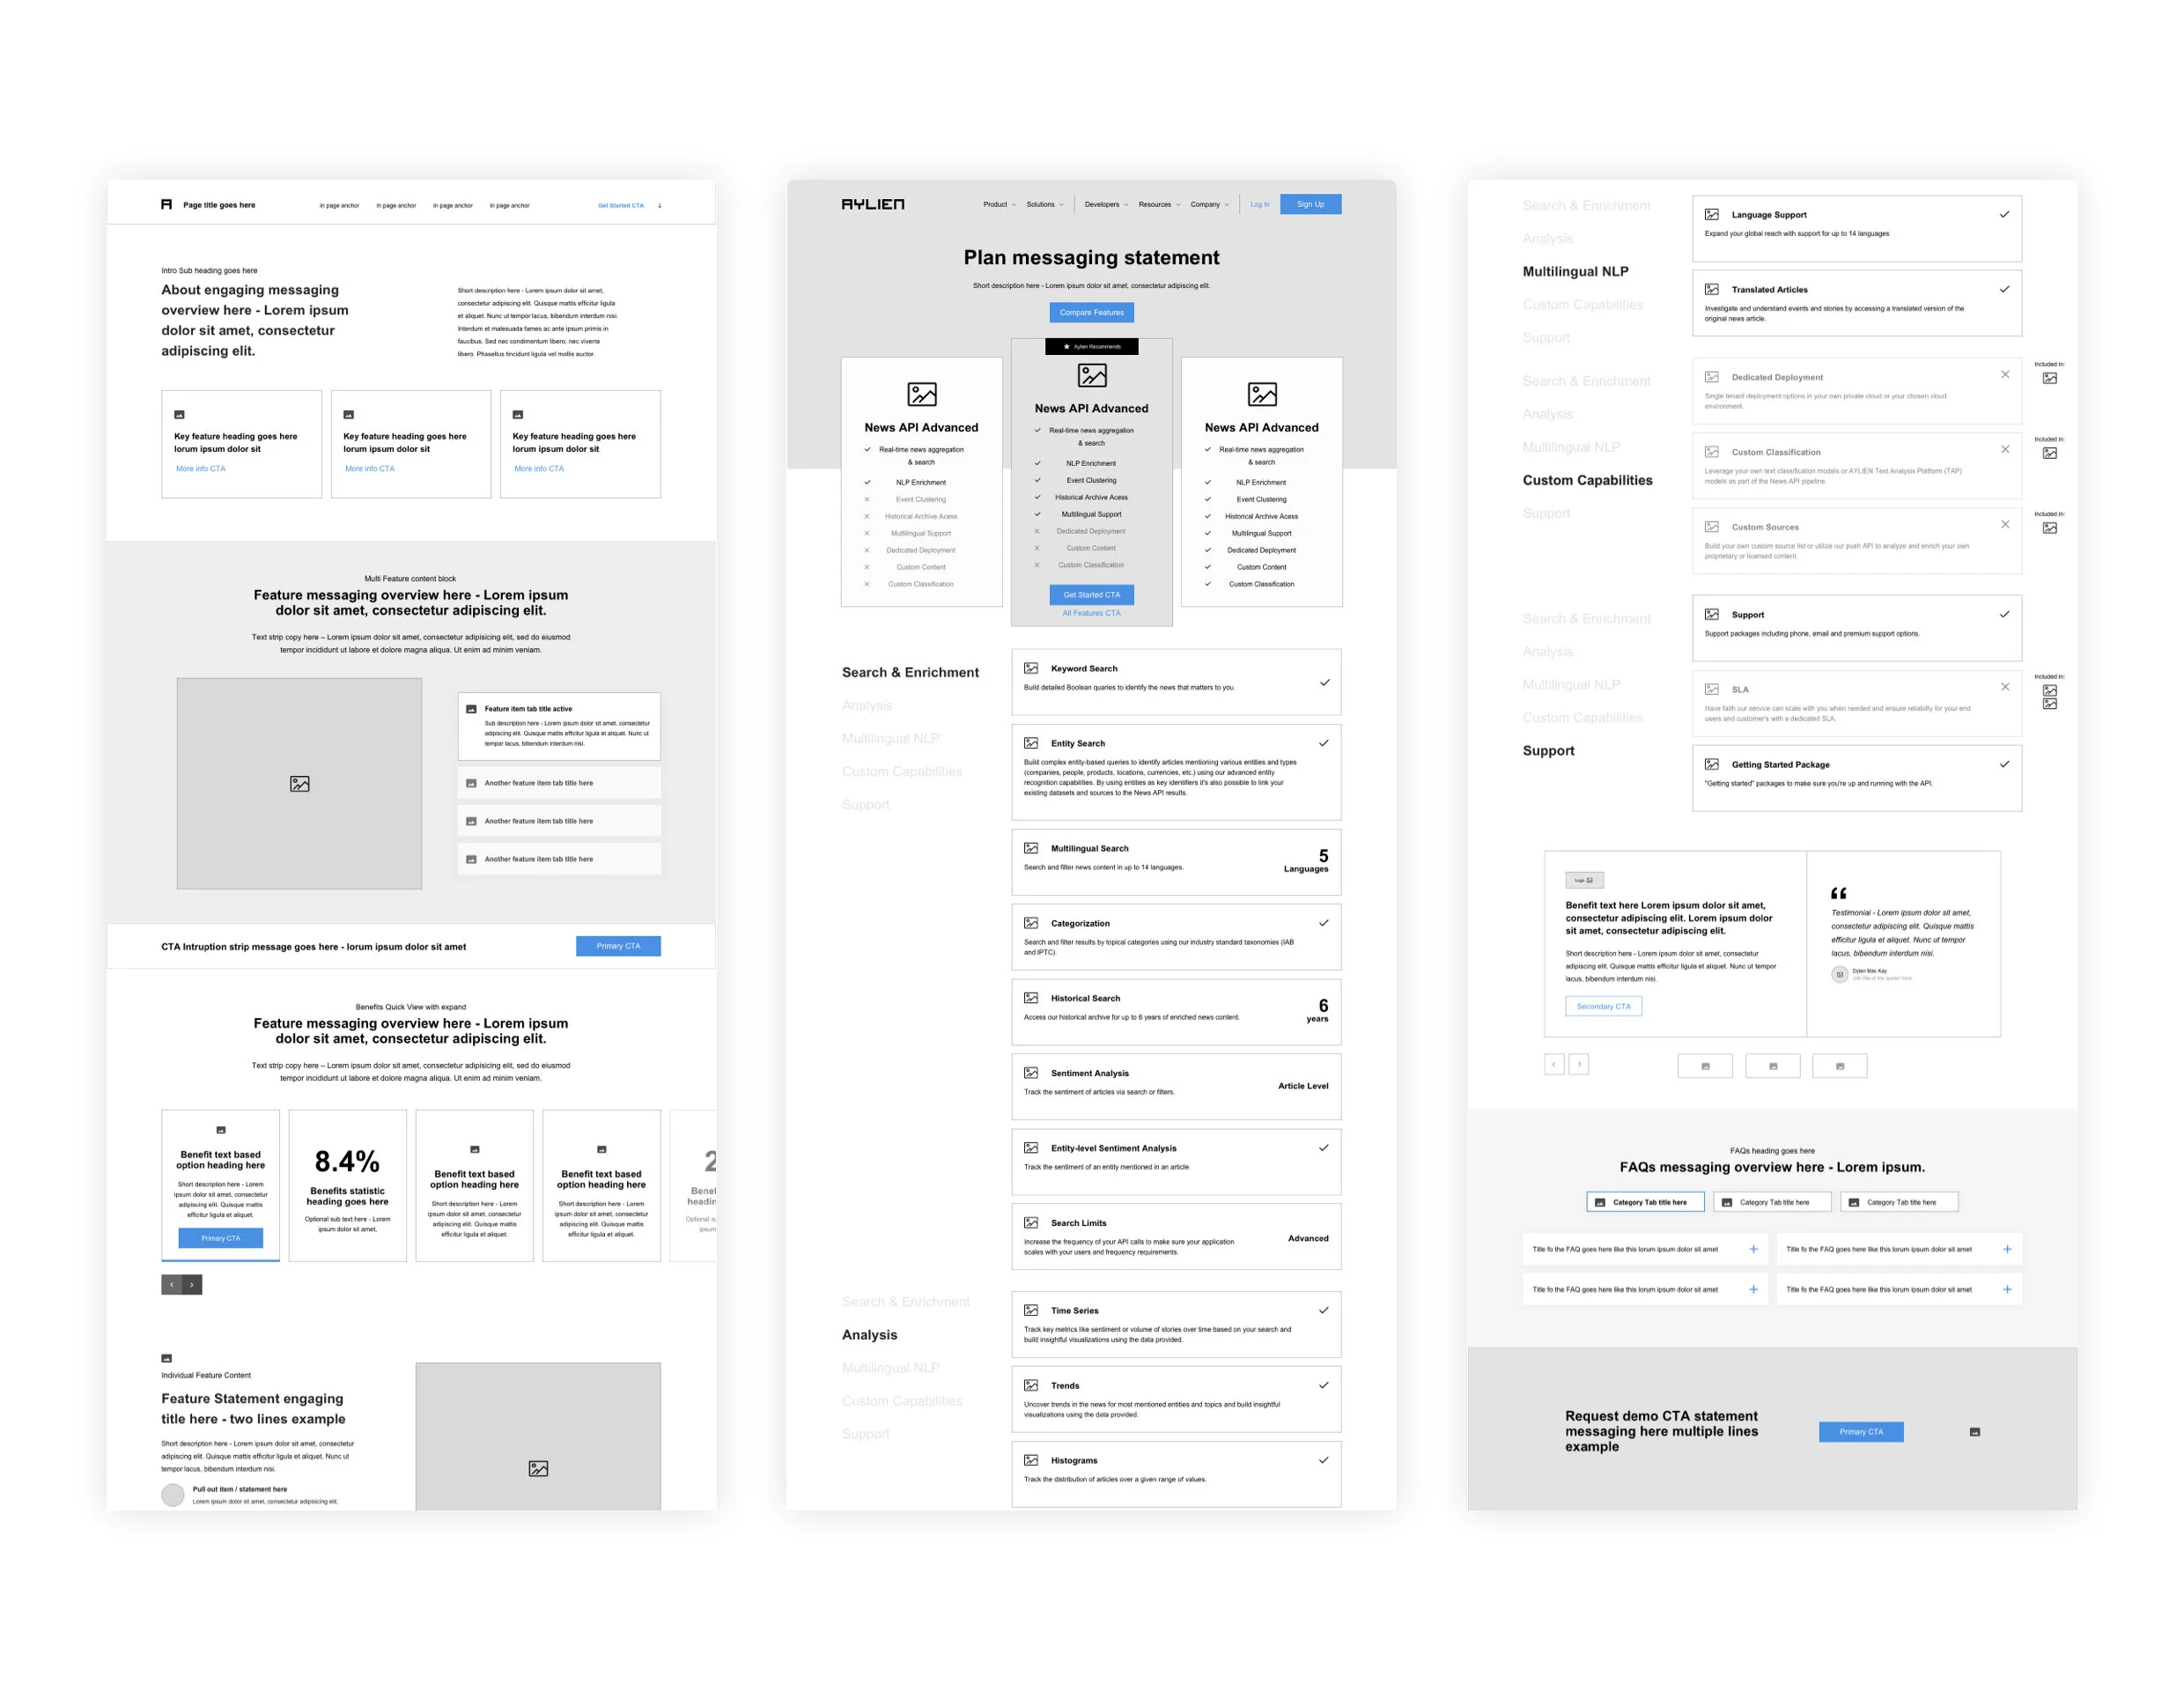
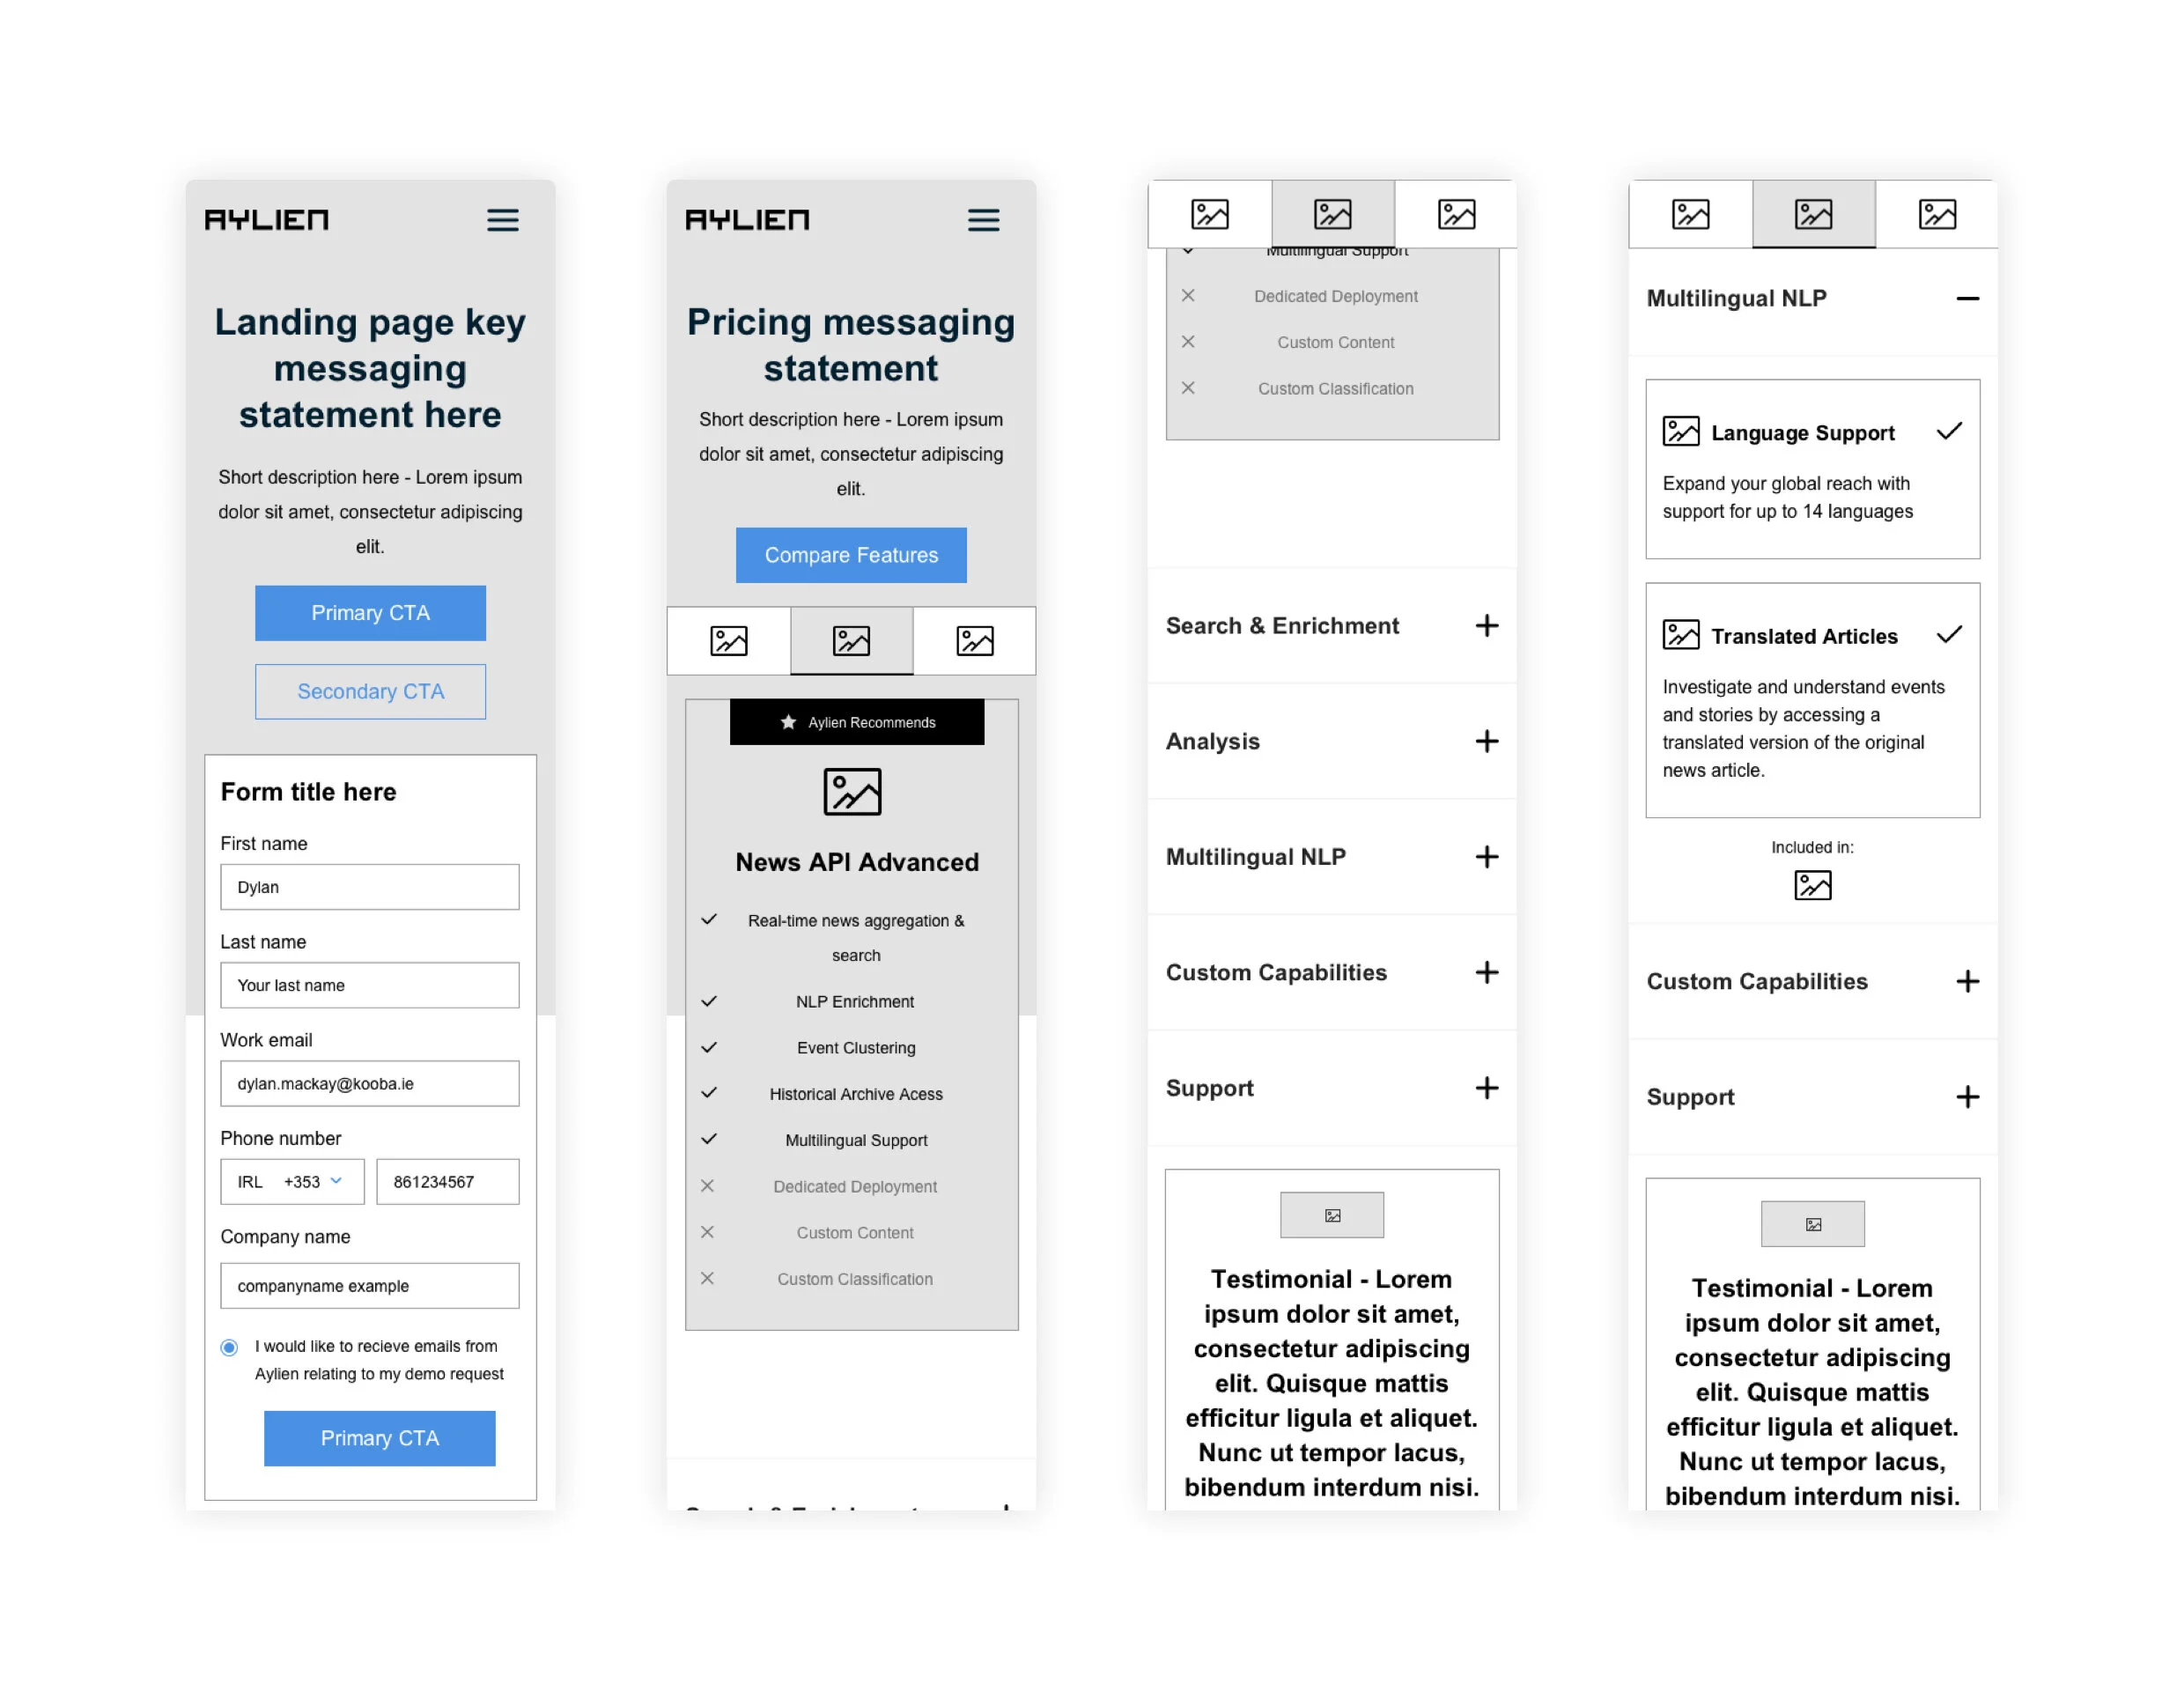
Creation of new website structures via a visual sitemap and testing of this.
Test existing site structure
Card sorting and planning sessions gaining insights into a new structure.
Creation of User flows
Data Insights
Google analytics was used to analyse the performance of the current website. From data alone I got a better understanding of both the users and the website :
User Behaviour
User flow and blockers
Key page and site performance
Behaviour Insights
Hotjar is used to analysis current user behaviour and in turn gives us deeper understanding of how users behave on your site
Review of Visualised user behaviour (Heatmaps) User clickmaps, Scroll position maps,Mouse movements and Screen recording of users
Discovery of what attracts attention
Analysis of where user attention drops
Make sense of web analytics
Concept Version 01
Concept Version 04